Gobinath Aroganam — Senior UX Designer & Researcher CV
Case Study · SIERA ESG Platform · 3+ years

Net Zero
Carbon

Role
UX Lead & Product Owner
Duration
3+ years, ongoing
Platform
B2B / B2C SaaS
Tools
Figma · Axure · Pendo · Dovetail
SIERA Net Zero Carbon
Research
18×
Participant growth in User research and usablity sessions
Engagement
38%
Increase in bespoke feature interaction
Task time
24%
Reduction in task completion time
Products
5
New products shipped within NZC
The Context

What is a real estate portfolio
and why does Net Zero matter?

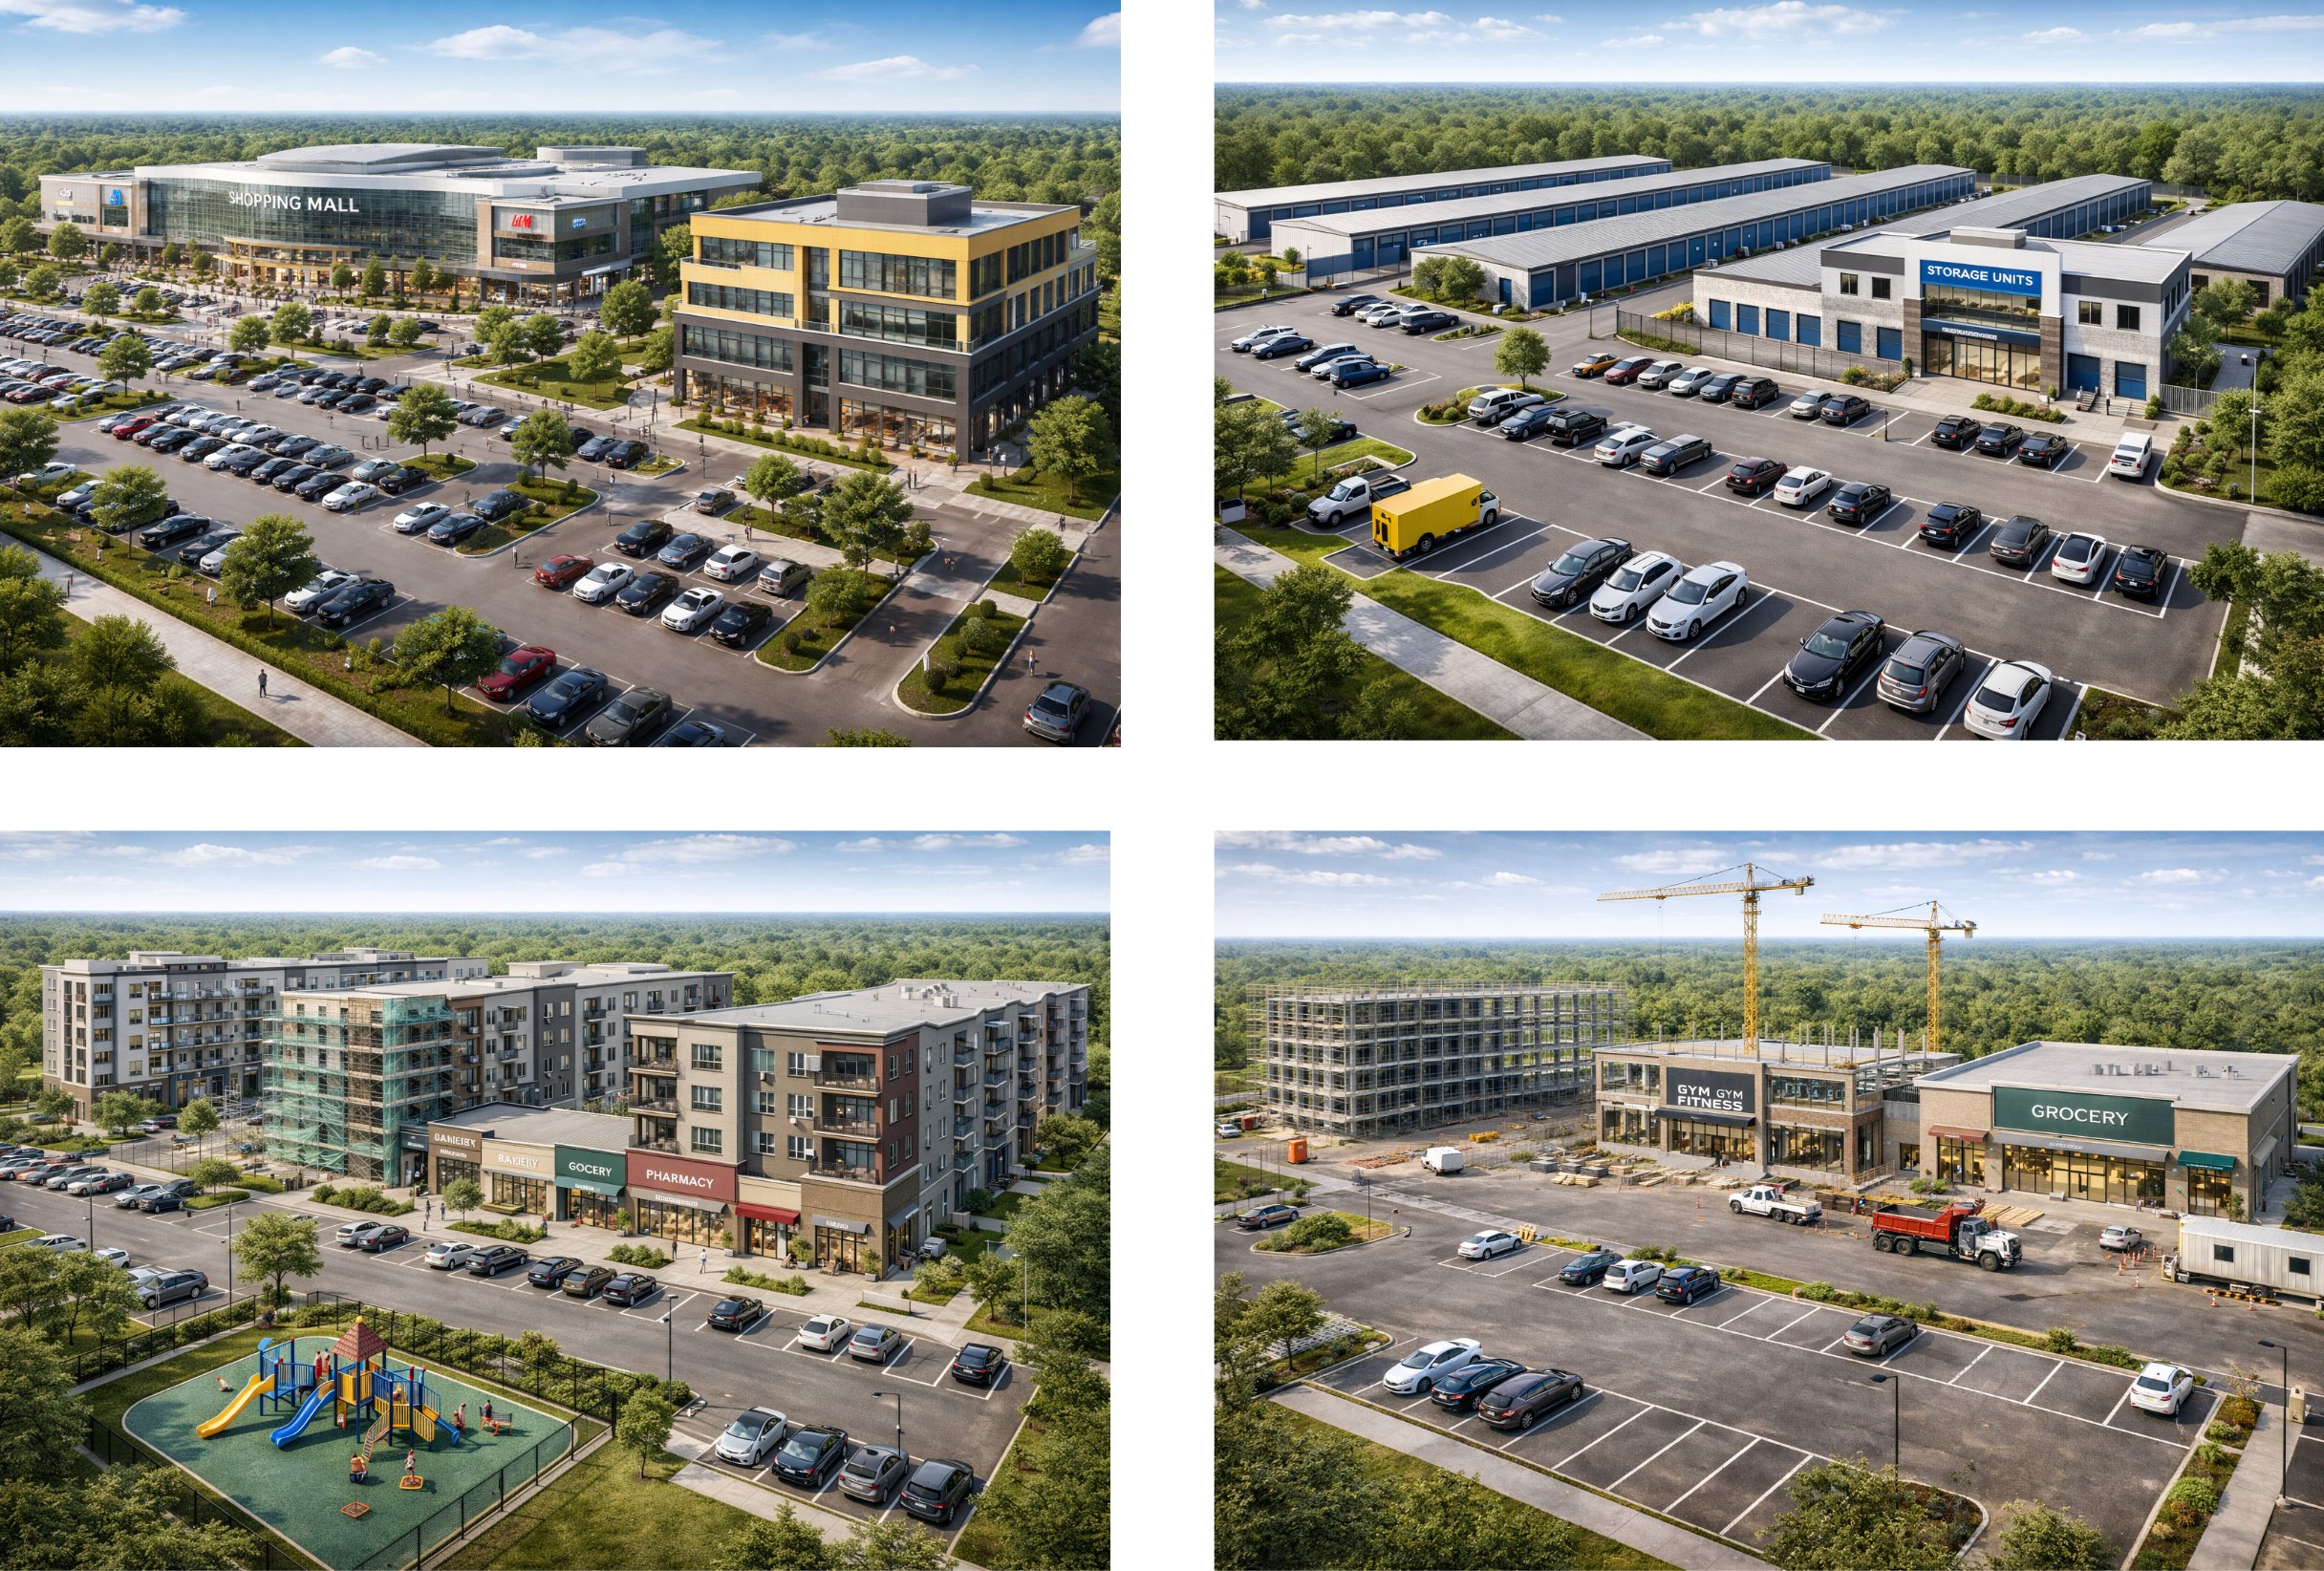
SIERA's clients manage large portfolios of real estate assets — office buildings, retail centres, hotels, storage facilities, residential blocks. Each asset has its own carbon footprint. Net Zero Carbon is the tool that lets fund managers see, model, and act on the carbon performance of every asset across their entire portfolio — from the fund level down to the individual building.

Fund Level — the full portfolio
Real estate portfolio — fund level view showing multiple asset types

A fund portfolio — multiple asset types, each with its own carbon intensity, data quality, and reduction pathway

Asset Level — individual properties within the fund
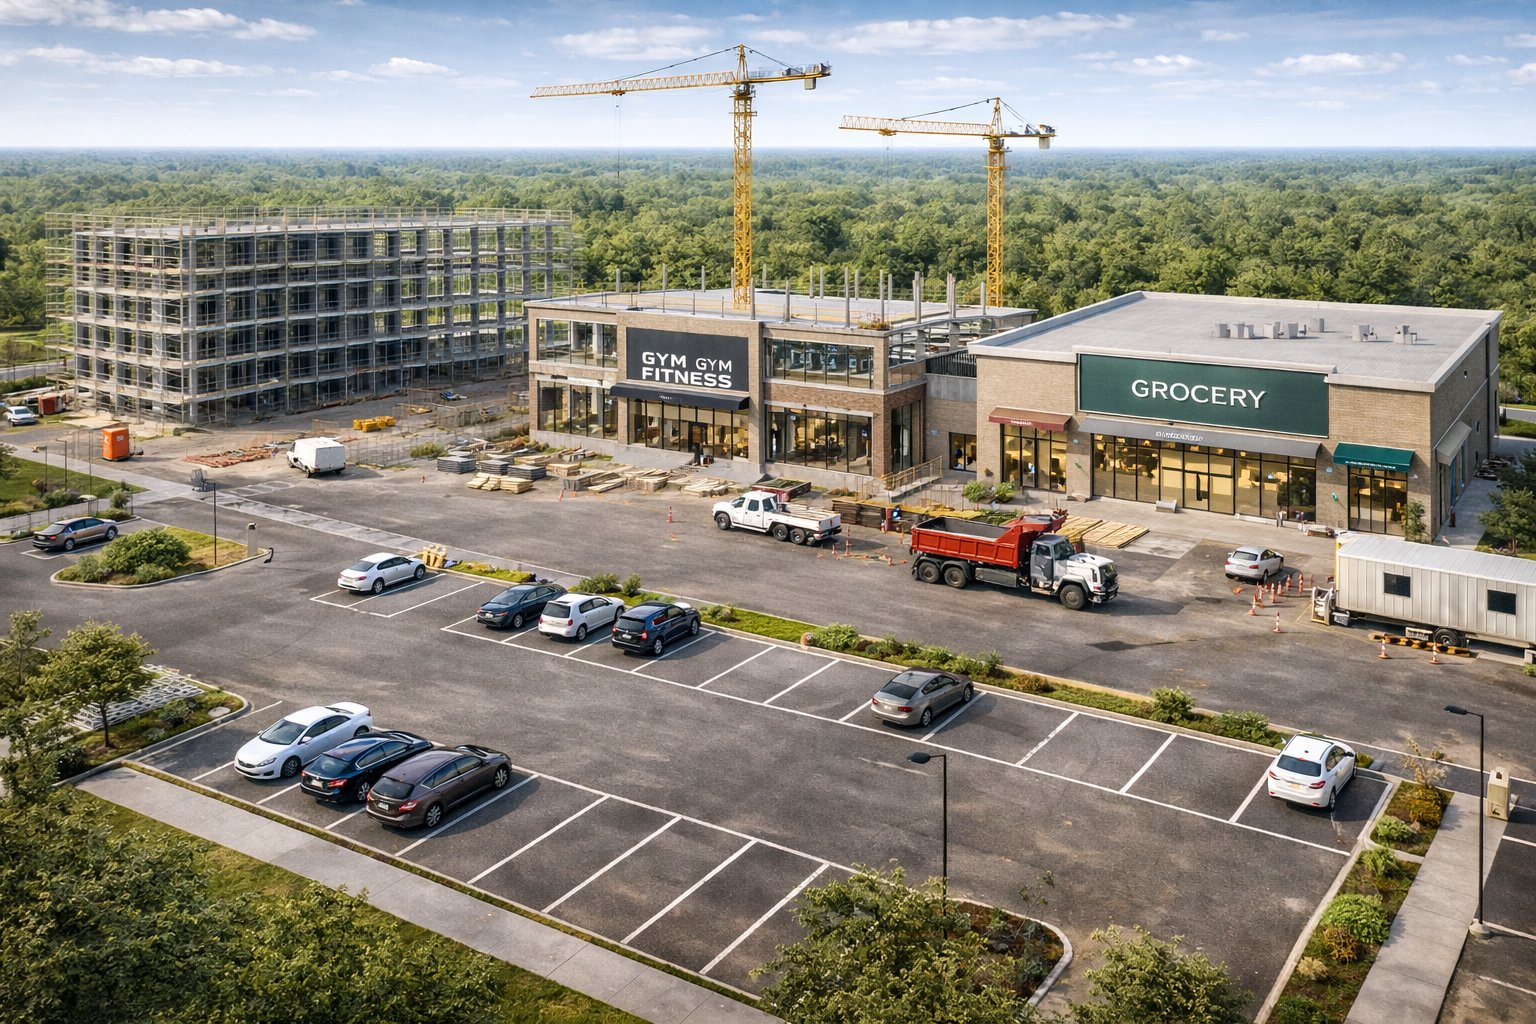
Commercial development under construction
Commercial Development
Under construction — carbon modelled from day one
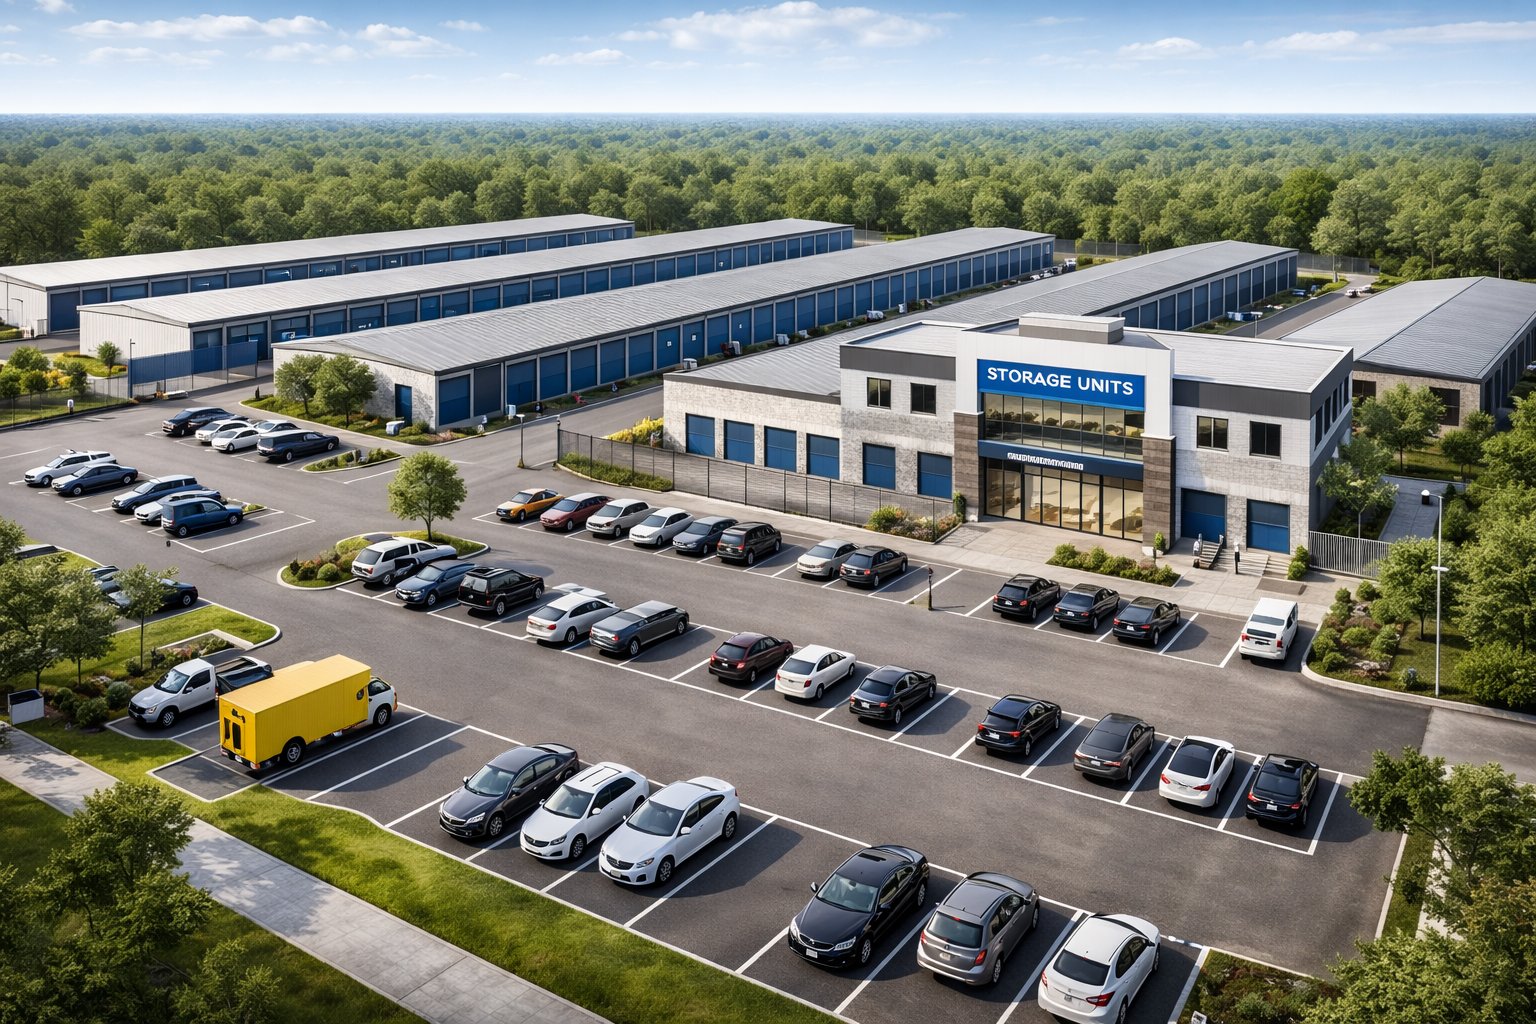
Industrial storage facility
Industrial & Storage
Energy-intensive assets with high reduction potential
Hotel and retail mixed use
Hotel & Mixed Use
Multiple use types tracked within a single asset model
Residential and retail development
Residential & Retail
Community-scale assets with diverse data requirements
🏗️
The challenge: one platform, thousands of assets, one Net Zero target
Fund managers needed to move fluidly between the portfolio view and individual asset level — understanding carbon intensity, data gaps, stranding risk, and intervention impact at every layer. That navigation challenge is what the Net Zero Carbon module was designed to solve.
Product Walkthrough

See the product in action

A 6-minute narrated walkthrough covering the strategic decisions behind the design, why Action Pathways became the feature that secured enterprise clients, and how the module evolved from a data visualiser into a commercial growth driver.

View Interactive Prototype on Figma

6 minute narrated walkthrough · Click play · Best viewed fullscreen

01 — The Problem

Powerful data.
No one could act on it.

Fund managers and sustainability consultants were working from Excel-based reports that were fragmented and inconsistent. The challenge was to translate this into a platform that made carbon performance legible, actionable, and trustworthy for investment decision-making.

Strategic Context — Why This Mattered
NZC was SIERA's highest-value commercial module — but usability failures were actively undermining client confidence. The constraint was rapid release cycles with a lean team. The opportunity: make NZC the clearest ESG tool in the market and it becomes the primary sales lever.
Pain Points — Consultant Excel Charts
😤High user frustration — charts unreadable without deep domain expertise
🌫️No visual distinction between historical data and future projections
🔍Data quality issues invisible until deep in the workflow
🗺️No clear Fund → Asset navigation path
📋Action pathways did not reflect real-world interventions
Design Opportunities
📐Rebuild IA: Fund → Asset Selection → Pathway drill-down
Colour + shape coded data quality icons for WCAG accessibility
🎯Solid vs dotted lines: instant time grammar for the chart
Action-based pathways showing real carbon reduction impact
🏗️Scalable foundations for 5+ future product extensions
02 — Research · Understanding Net Zero

Immersing in the
science behind Net Zero

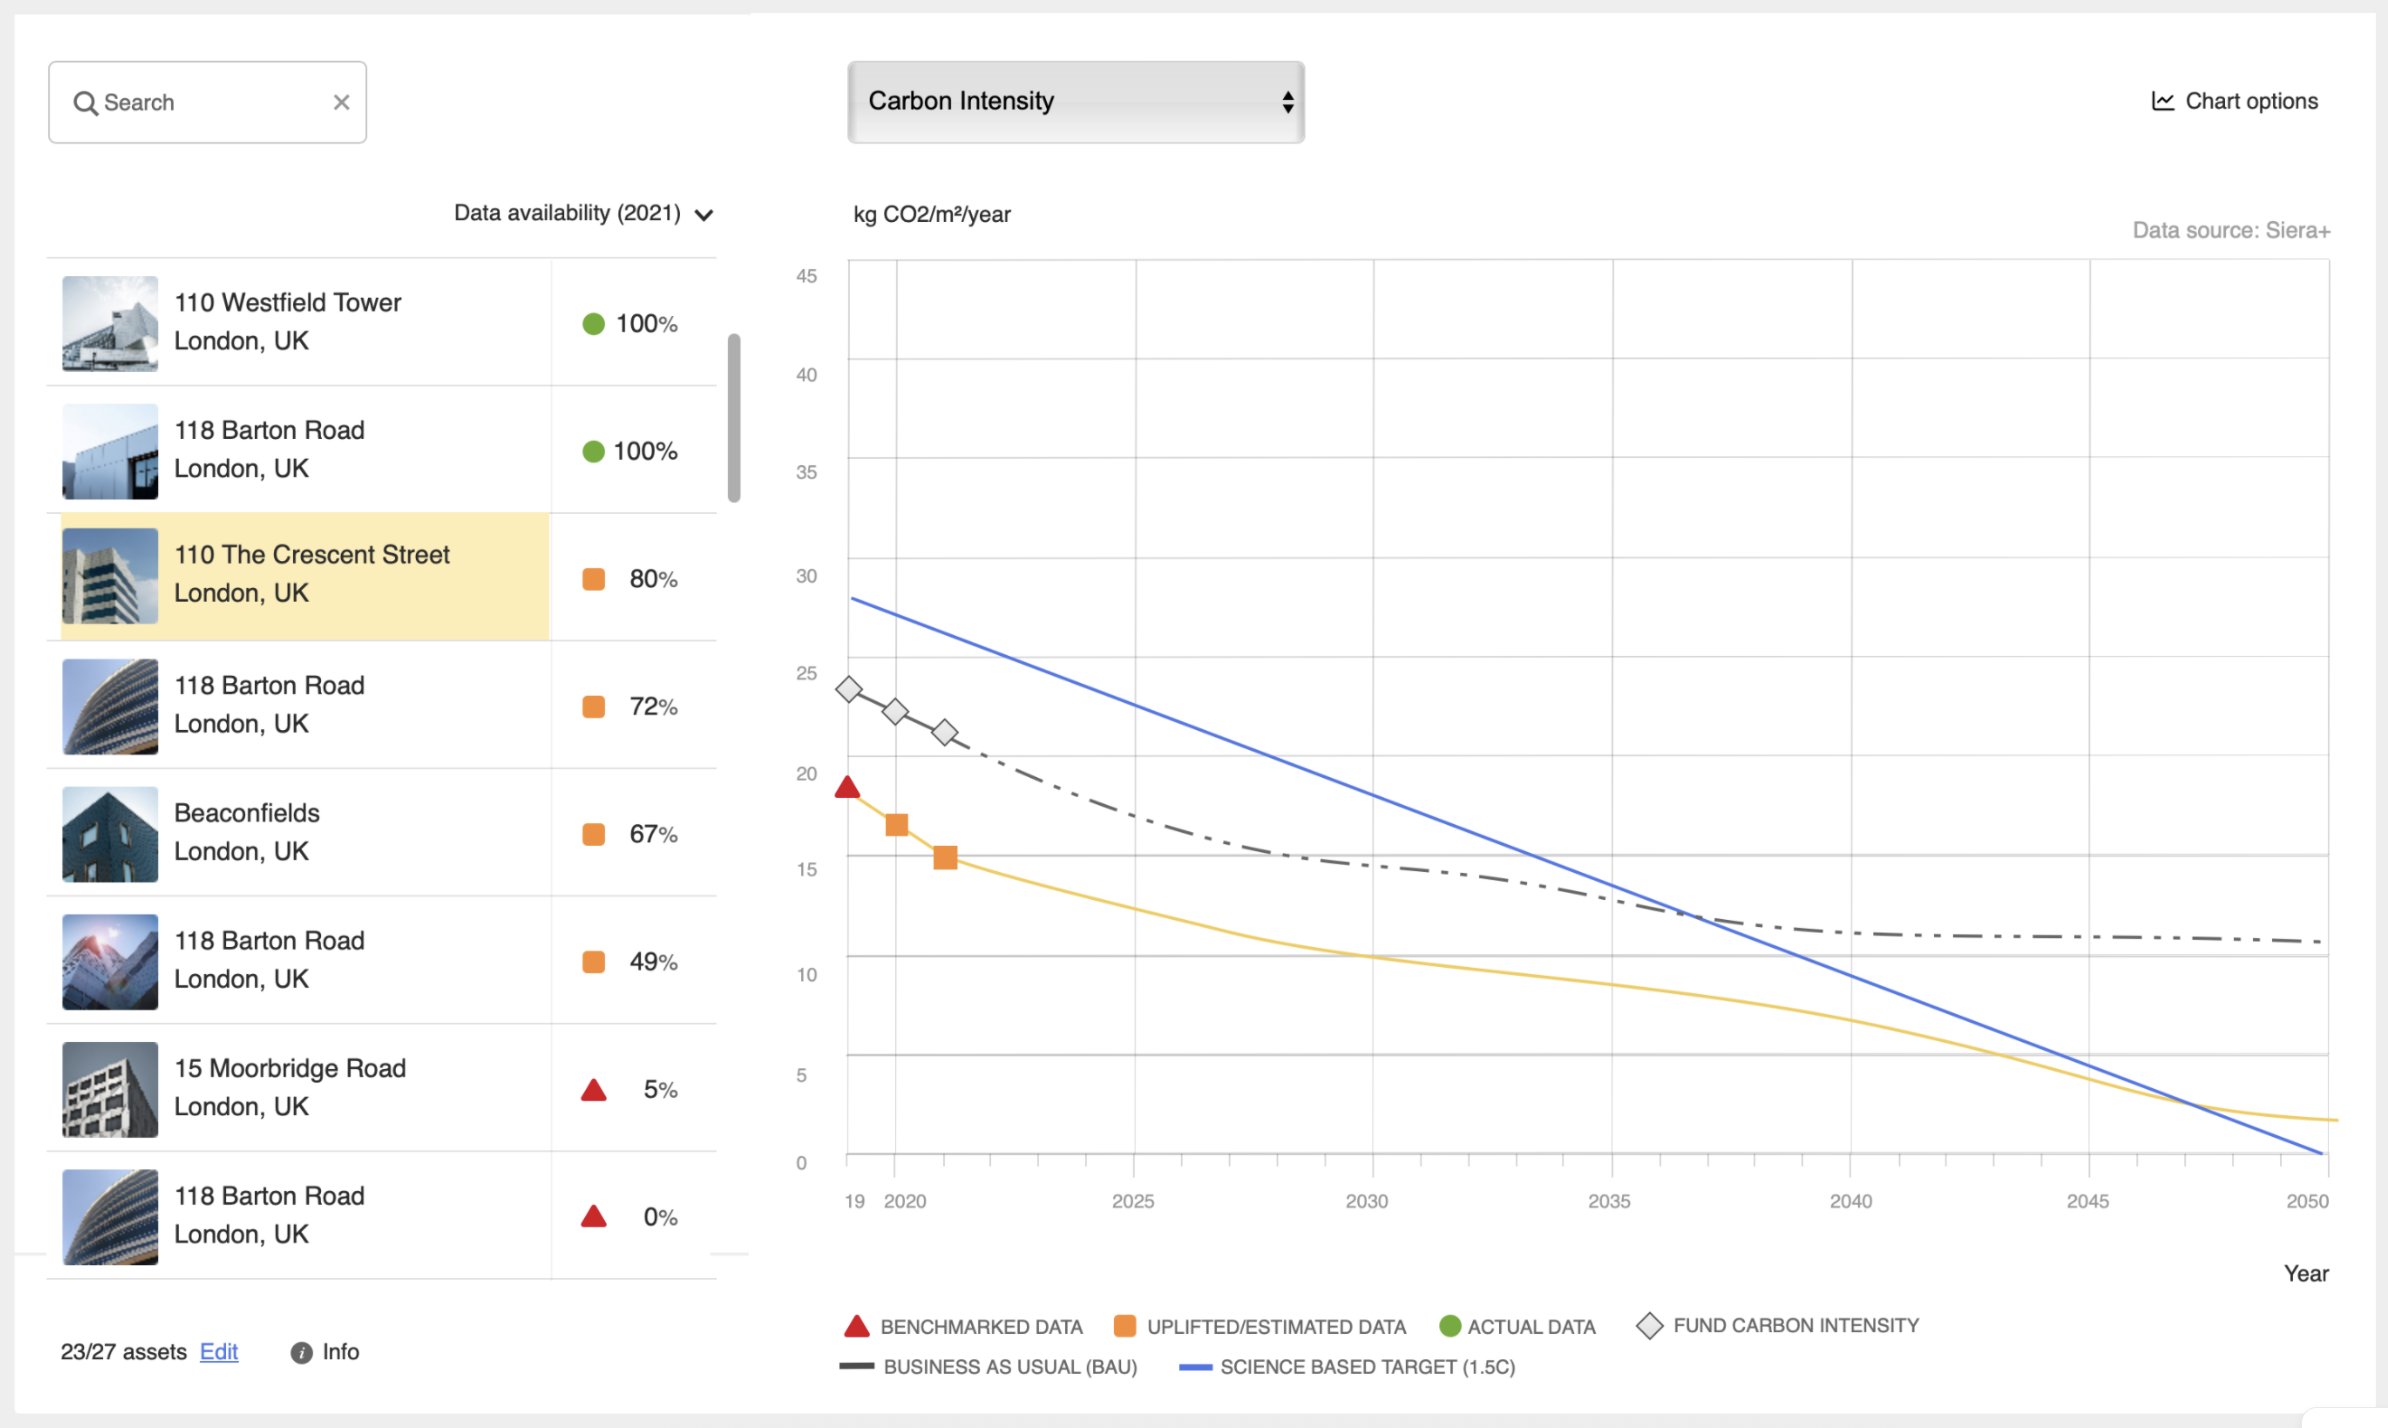
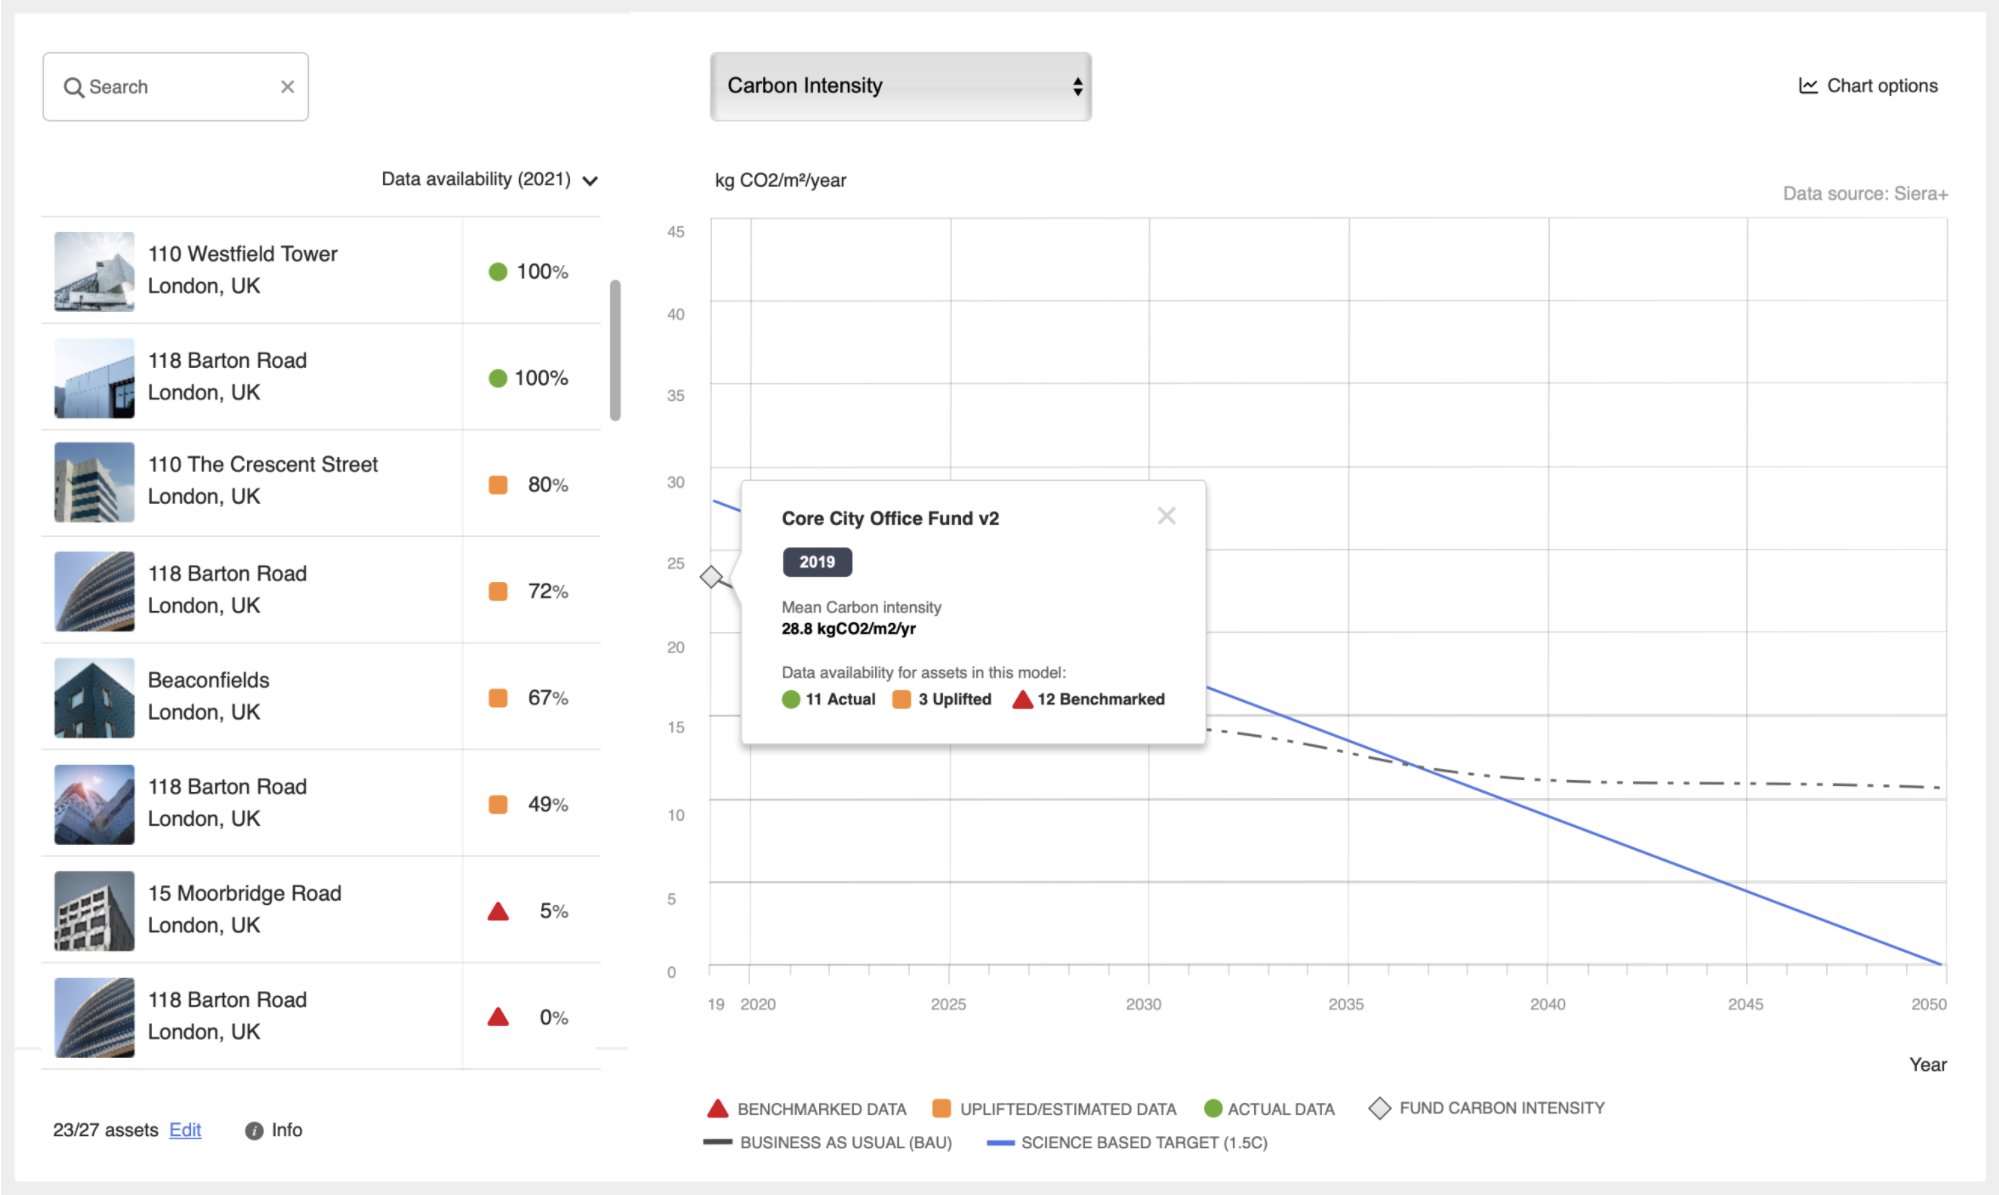
I conducted stakeholder workshops as part of my primary research phase to learn from sustainability consultants who explained real-life cases for Net Zero, as well as the offline reports generated for clients. I studied the fundamental building blocks of a Net Zero chart before designing a single element.
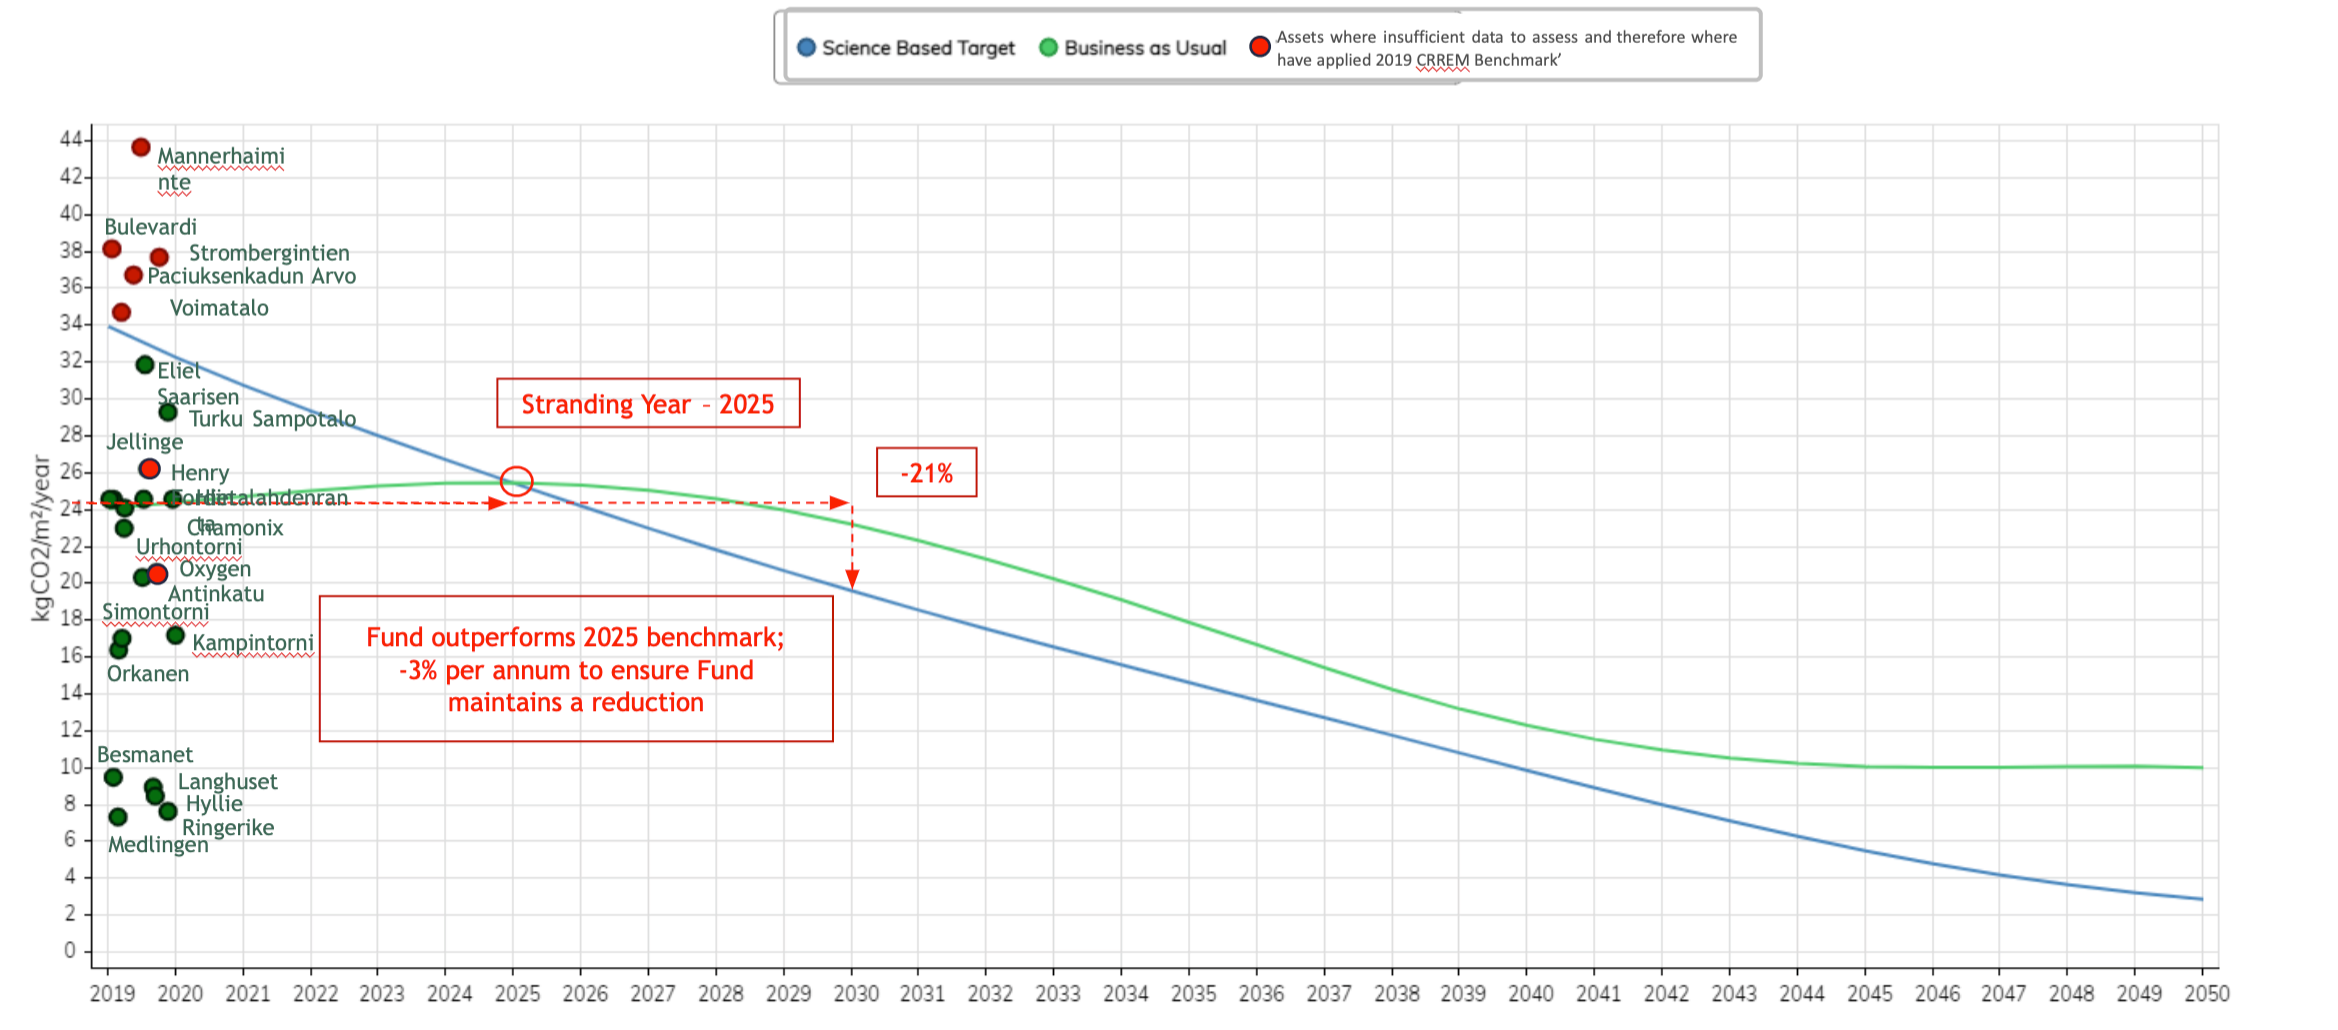
Net Zero chart
Net Zero chart
What I learnt: NZC chart fundamentals
Asset Data Points
All assets in the fund portfolio, each plotted individually on the chart.
Data Quality
Indicators showing the completeness and reliability of reported data for each asset.
Carbon Intensity
Greenhouse gas emissions relative to portfolio size (tCO₂e per $M invested).
Energy Intensity
Energy consumption relative to portfolio metrics (kWh per m² or $M invested).
Pathways
Forecasted trajectories showing whether the fund is on track to meet Net Zero targets based on current performance and planned reductions.
02 — Research · Information Architecture

Remapping how users
think about carbon data

Card sorting with real users revealed the gap between how engineers structured the data and how users mentally organise carbon performance. I rebuilt the entire IA around user mental models.
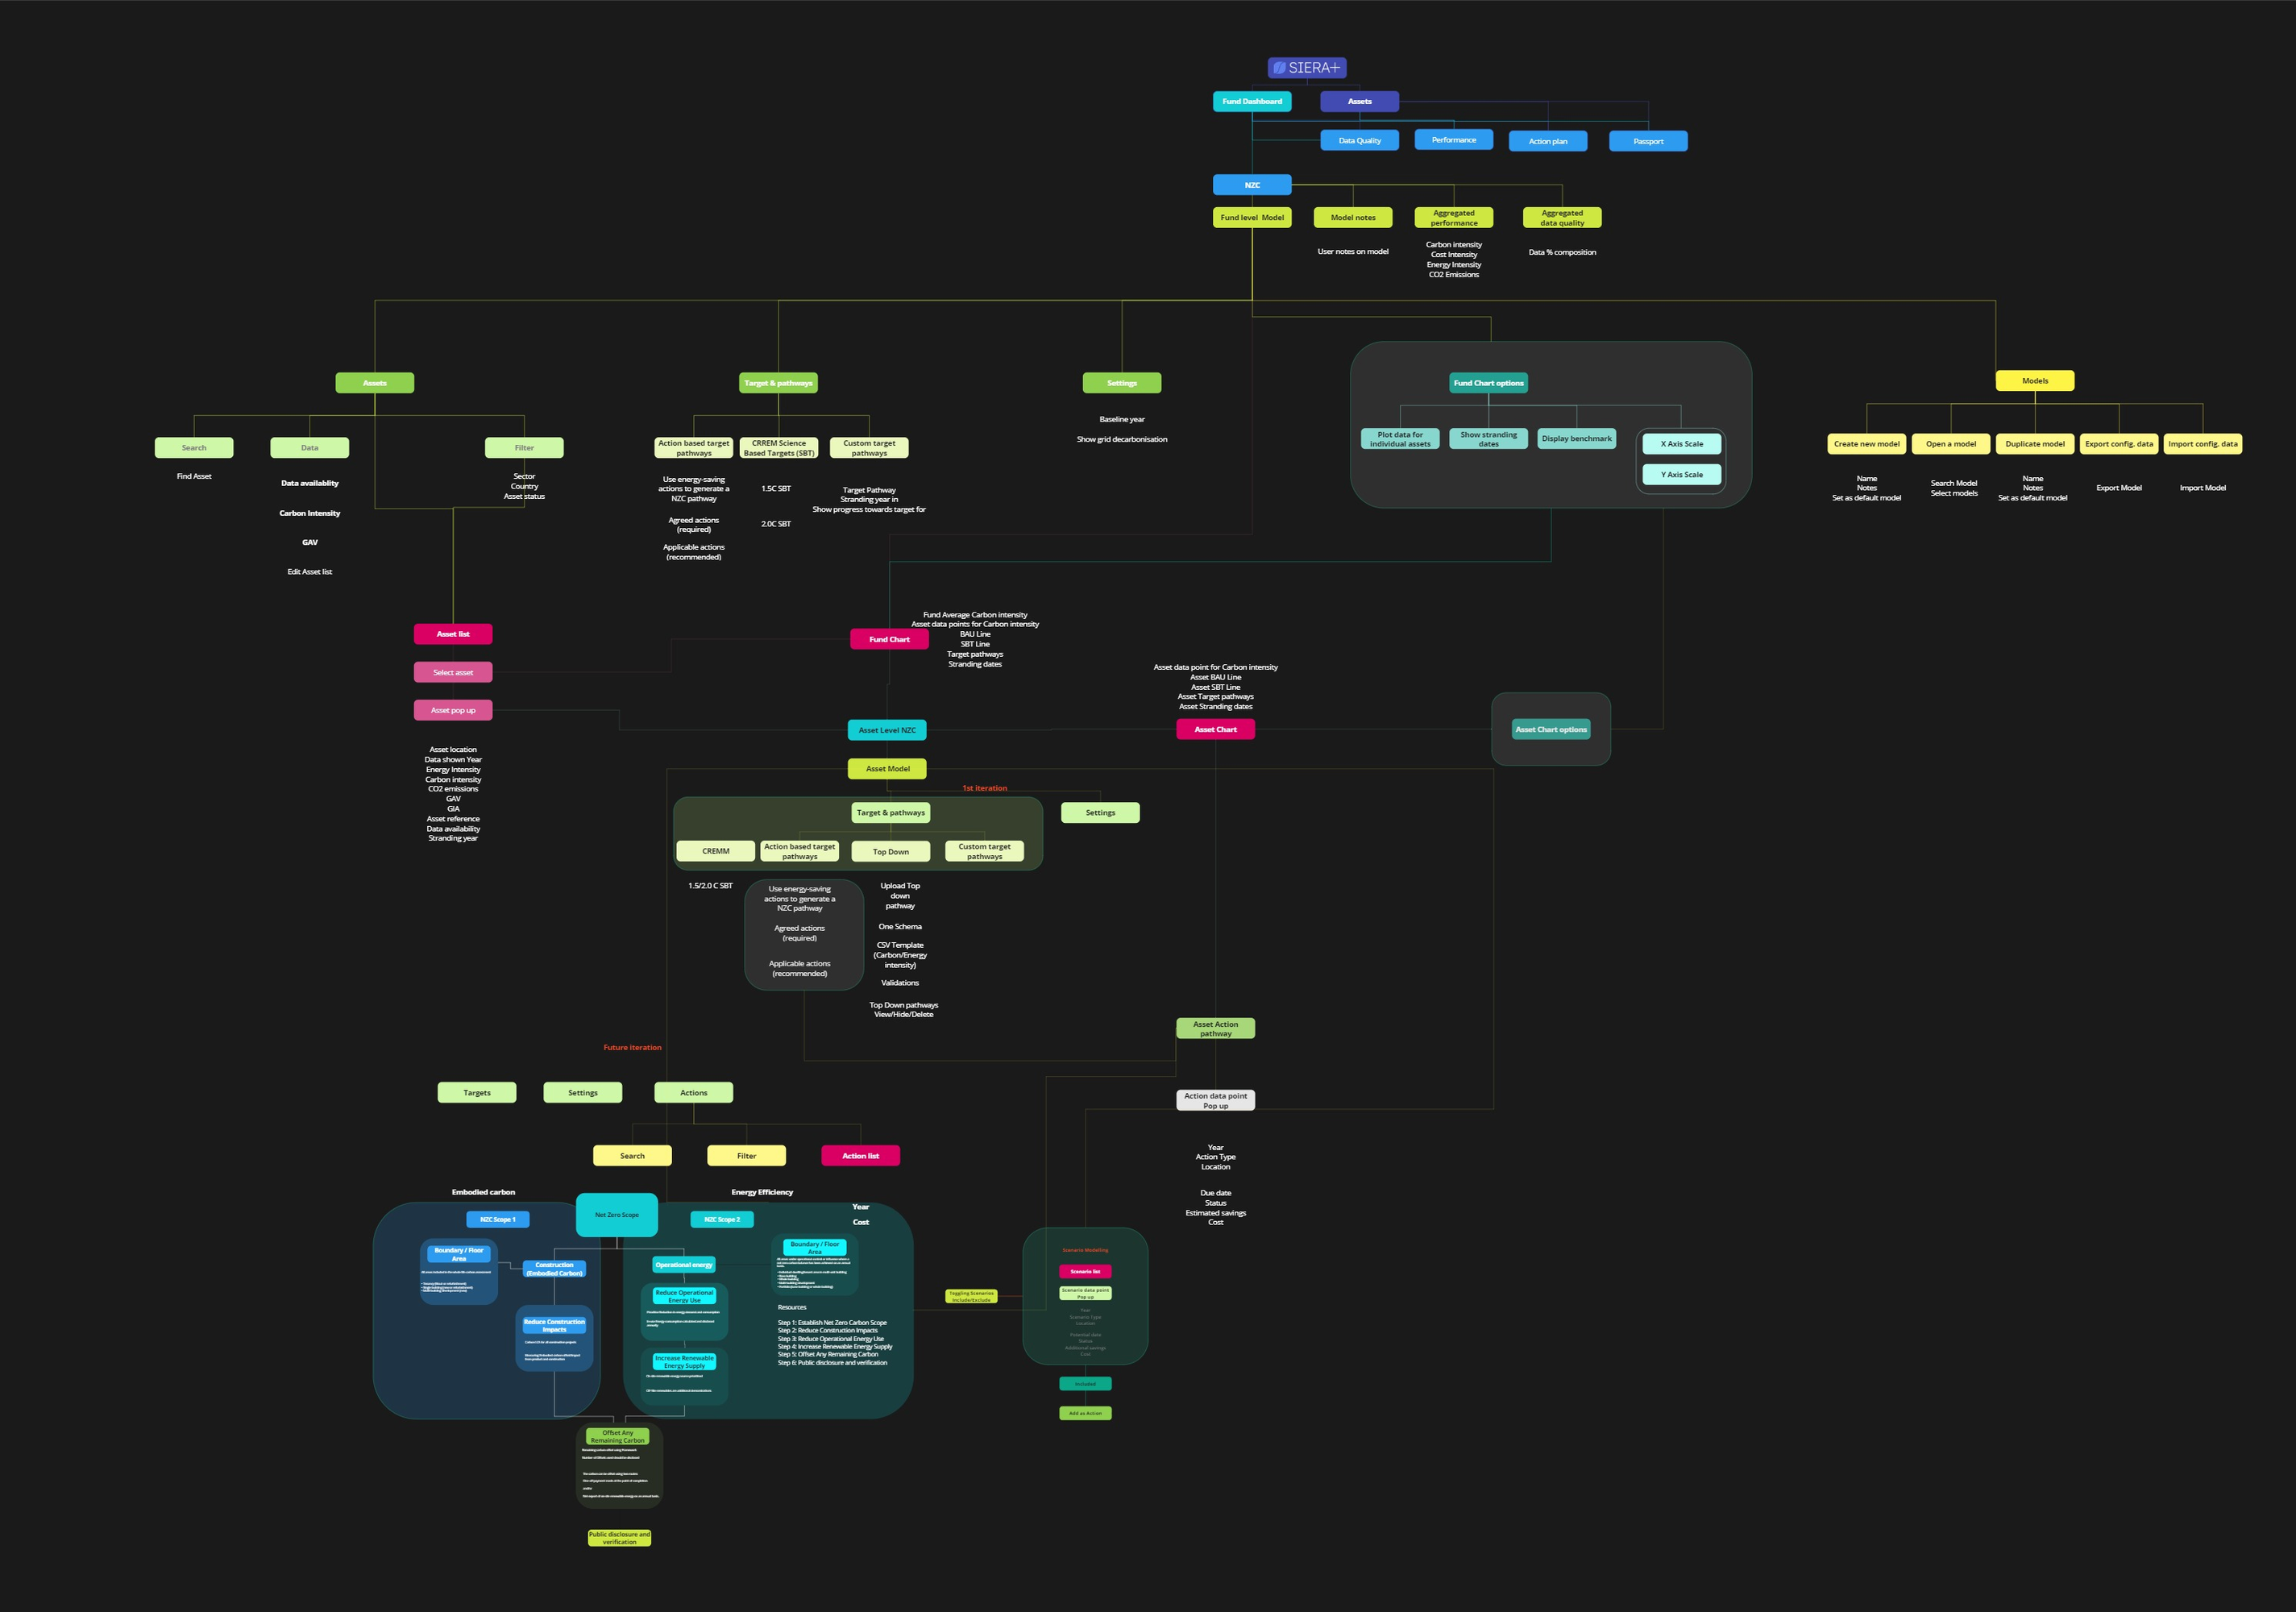
Net Zero Carbon IA diagram
Full IA map — constructed through card sorting and stakeholder workshops before any wireframes were started
02 — Research · Process

Research that
shaped strategy

Scaled from 4 to 72 participants within my first month — a continuous mixed-methods discovery loop that shaped the roadmap, not just validated decisions already made.

01
Stakeholder Workshops & Domain Immersion
Studied environmental science, carbon accounting, and global Net Zero frameworks. Ran workshops with sustainability consultants to understand real-life client reporting scenarios and the offline reports they generate for investors.
Stakeholder WorkshopsDomain ResearchMiro
02
Moderated Sessions & Support Ticket Analysis
Sessions recorded and transcribed. Re-listened to understand the methodologies and calculations within Net Zero — not just surface UX pain. Support tickets mined for recurring high-frequency issues.
Moderated TestingThematic AnalysisDovetailSupport Tickets
03
Card Sorting & IA Rebuild
Card sorting revealed how users contextualise NZC attributes. Remapped the entire IA from engineer-structured hierarchy to one aligned with user mental models and scientific data requirements.
Card SortingIA RedesignNavigation Design
04
3-Phase Strategic Roadmap
Built long-term roadmap with Engineering Lead. Phase 1: Navigation, accessibility, UX fundamentals. Phase 2: Action plan integration. Phase 3: Scenario modelling and pathway importing.
RoadmapSprint PlanningKPI Definition
03 — User Needs

Three users.
One product.

A critical early insight: the client who signs the contract is not always the end user. I mapped this distinction explicitly — it changed how we prioritised information hierarchy across the module.

👩‍💼
Primary User
Sustainability Consultant
Client reporting & compliance
Core Needs
Rapid accurate data for client reports
Instant visibility of data quality gaps
Exportable outputs without reformatting
Friction
Too many steps to reach actionable insight
No clear fund vs. asset distinction
📊
Secondary User
Portfolio Manager
Fund performance & NZC targets
Core Needs
Compare assets against NZC targets visually
Model action plans to evaluate strategies
Understand BAU vs target pathway clearly
Friction
Pathways did not reflect real interventions
High cognitive load across multiple funds
🏛️
Executive User
ESG Director
Strategic oversight & board reporting
Core Needs
High-level overview without platform expertise
Clear progress vs science-based targets
Board-ready outputs in one click
Friction
Platform too technical for strategic use
Cannot assess cross-fund performance quickly
03 — User Needs · Flow

End-to-end user flow

Constructed a flow chart mapping how users navigate from Fund Dashboard through to Asset-level NZC pathways, capturing both journey branches and how they differ across user types.
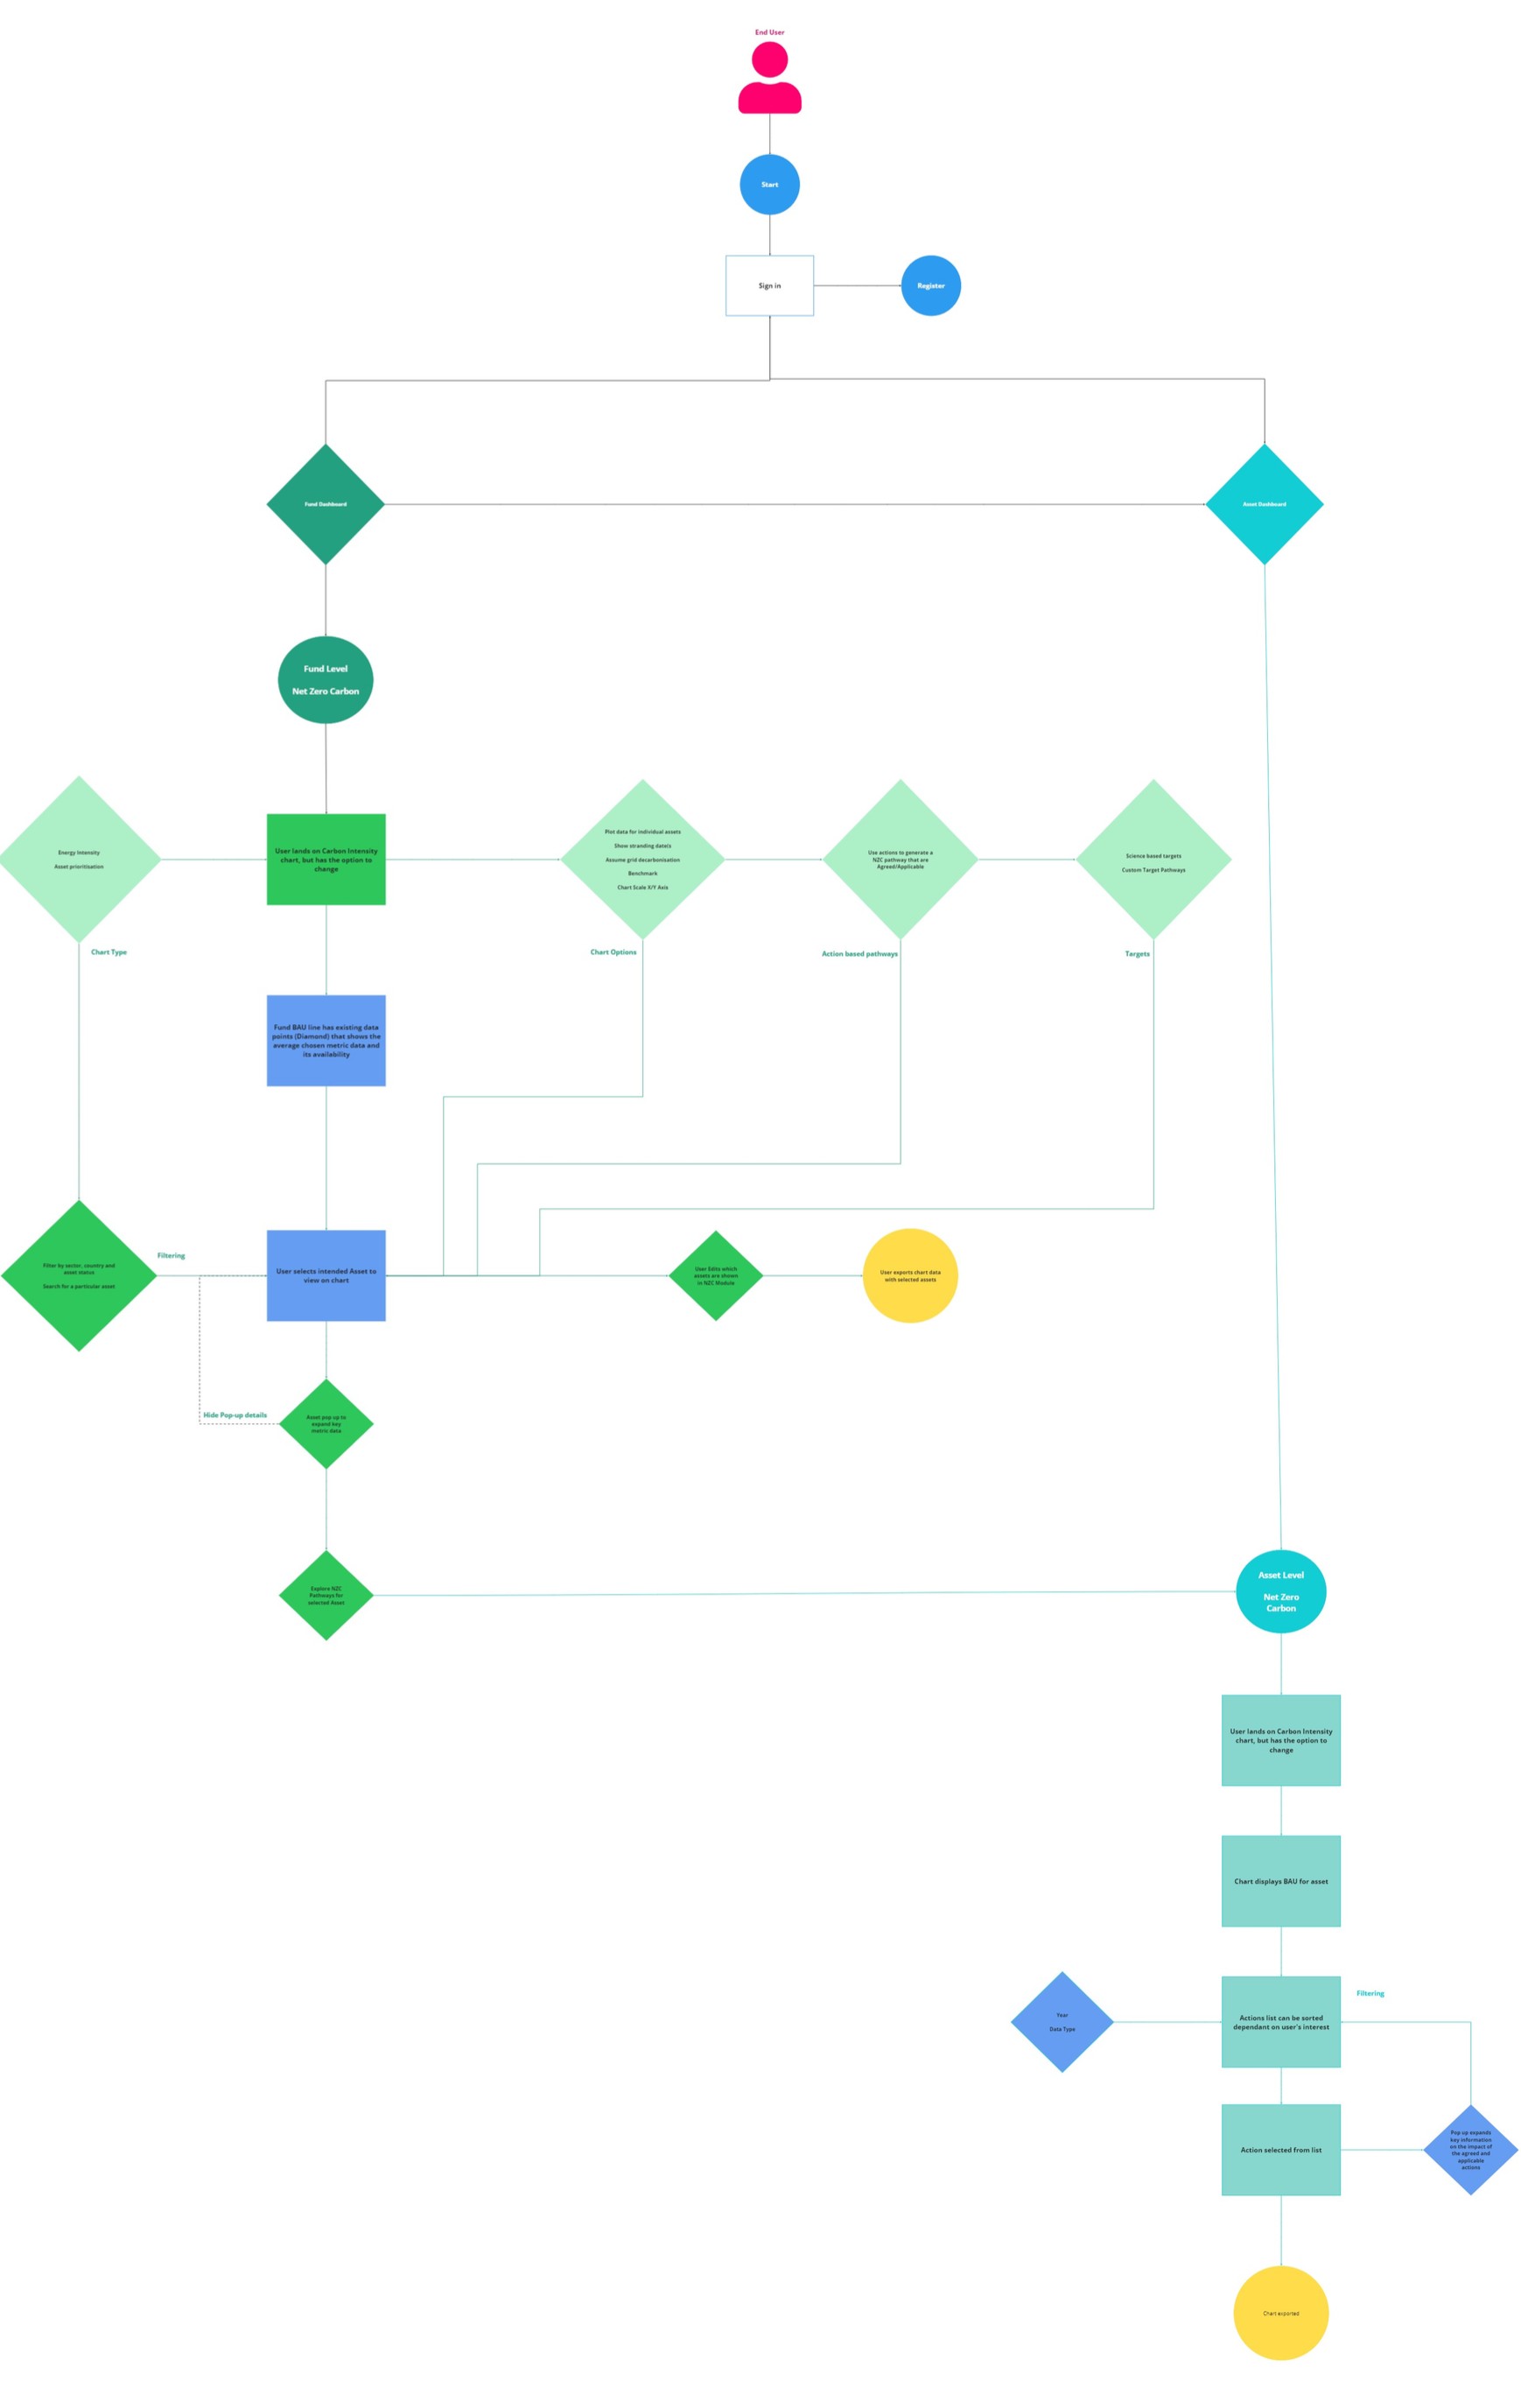
Net Zero Carbon user needs flow chart
User needs flow chart — Fund Dashboard to Asset-level NZC pathways across all user types
04 — Design · Usability Testing

Validating with users
across all expertise levels

Before developing Net Zero 1.0, I conducted additional usability sessions to validate proposed changes. My goal was to ensure the redesign worked for users with varying levels of expertise in both Net Zero concepts and the SIERA platform.

Self-rated expertise scale

I interviewed participants from complete novices to seasoned experts, asking them to self-rate their experience on a 5-point scale. This allowed me to dissect differences in perception, workflow, and cognitive expectations between user types — part of my focus on making SIERA a truly scalable SaaS solution that works for all abilities.

1
Novice
2
Learning
3
Average
4
Competent
5
Expert

As new features were introduced into Net Zero, I repeated these evaluations to continually stress-test the product. By working in an agile, feedback-driven loop, the module evolved rapidly while maintaining product market alignment and delivering measurable user value.
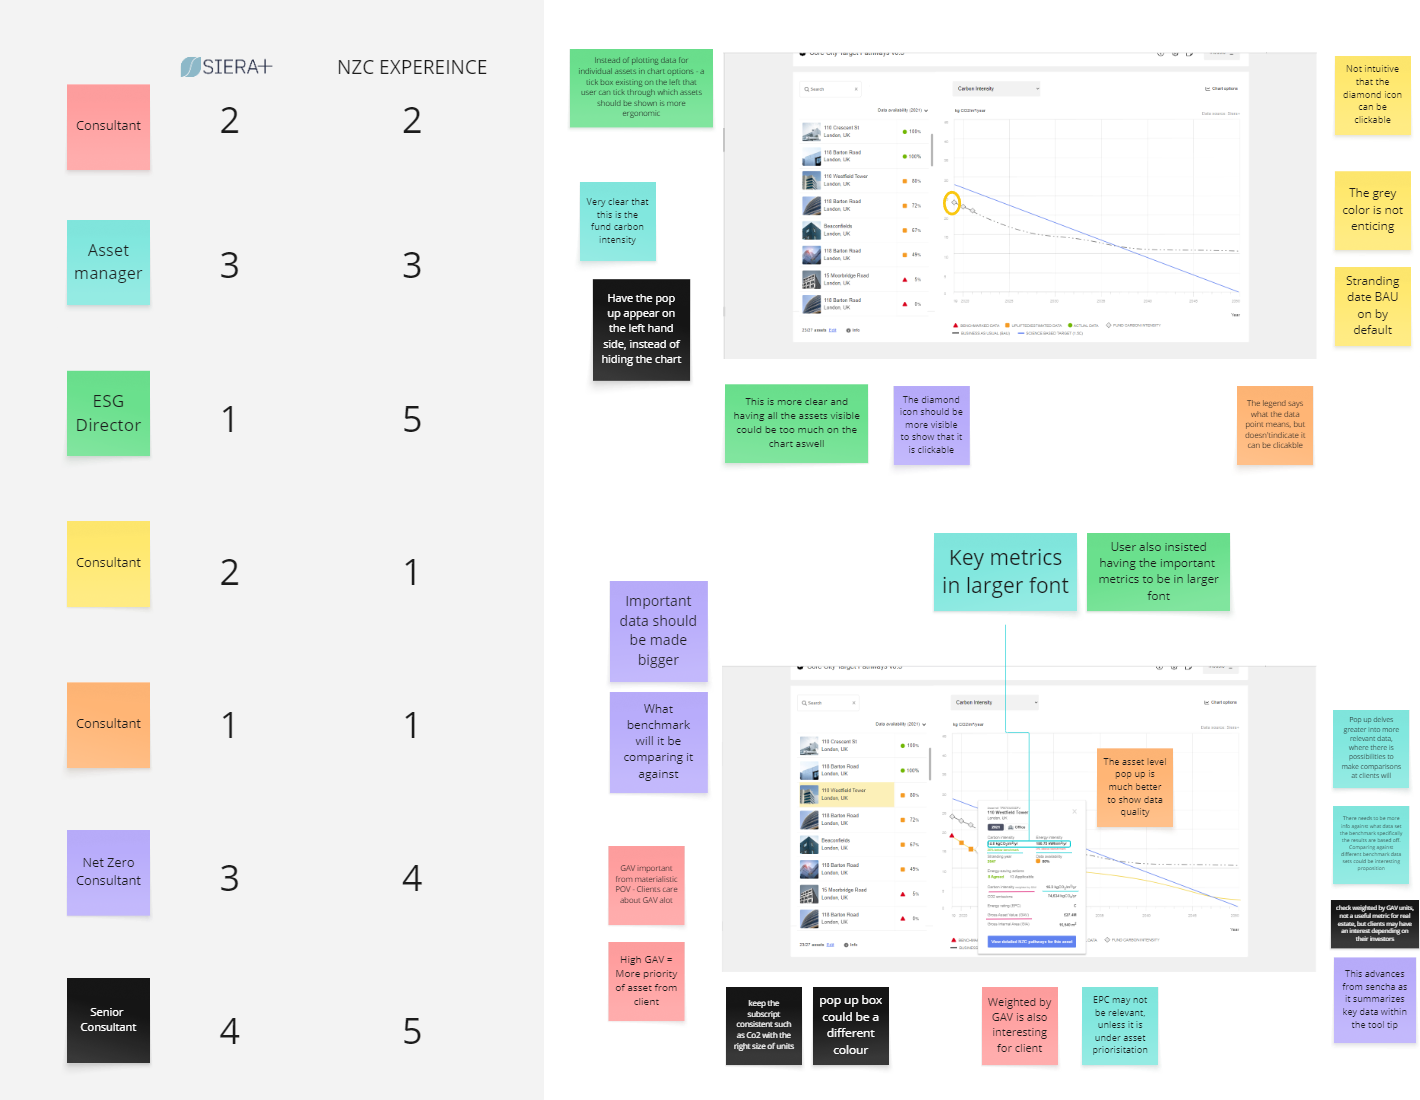
Usability testing feedback analysis
User testing feedback analysis on an iteration from Fund to Asset NZC
04 — Design · Action-Based Pathways

Interventions that
move the pathway

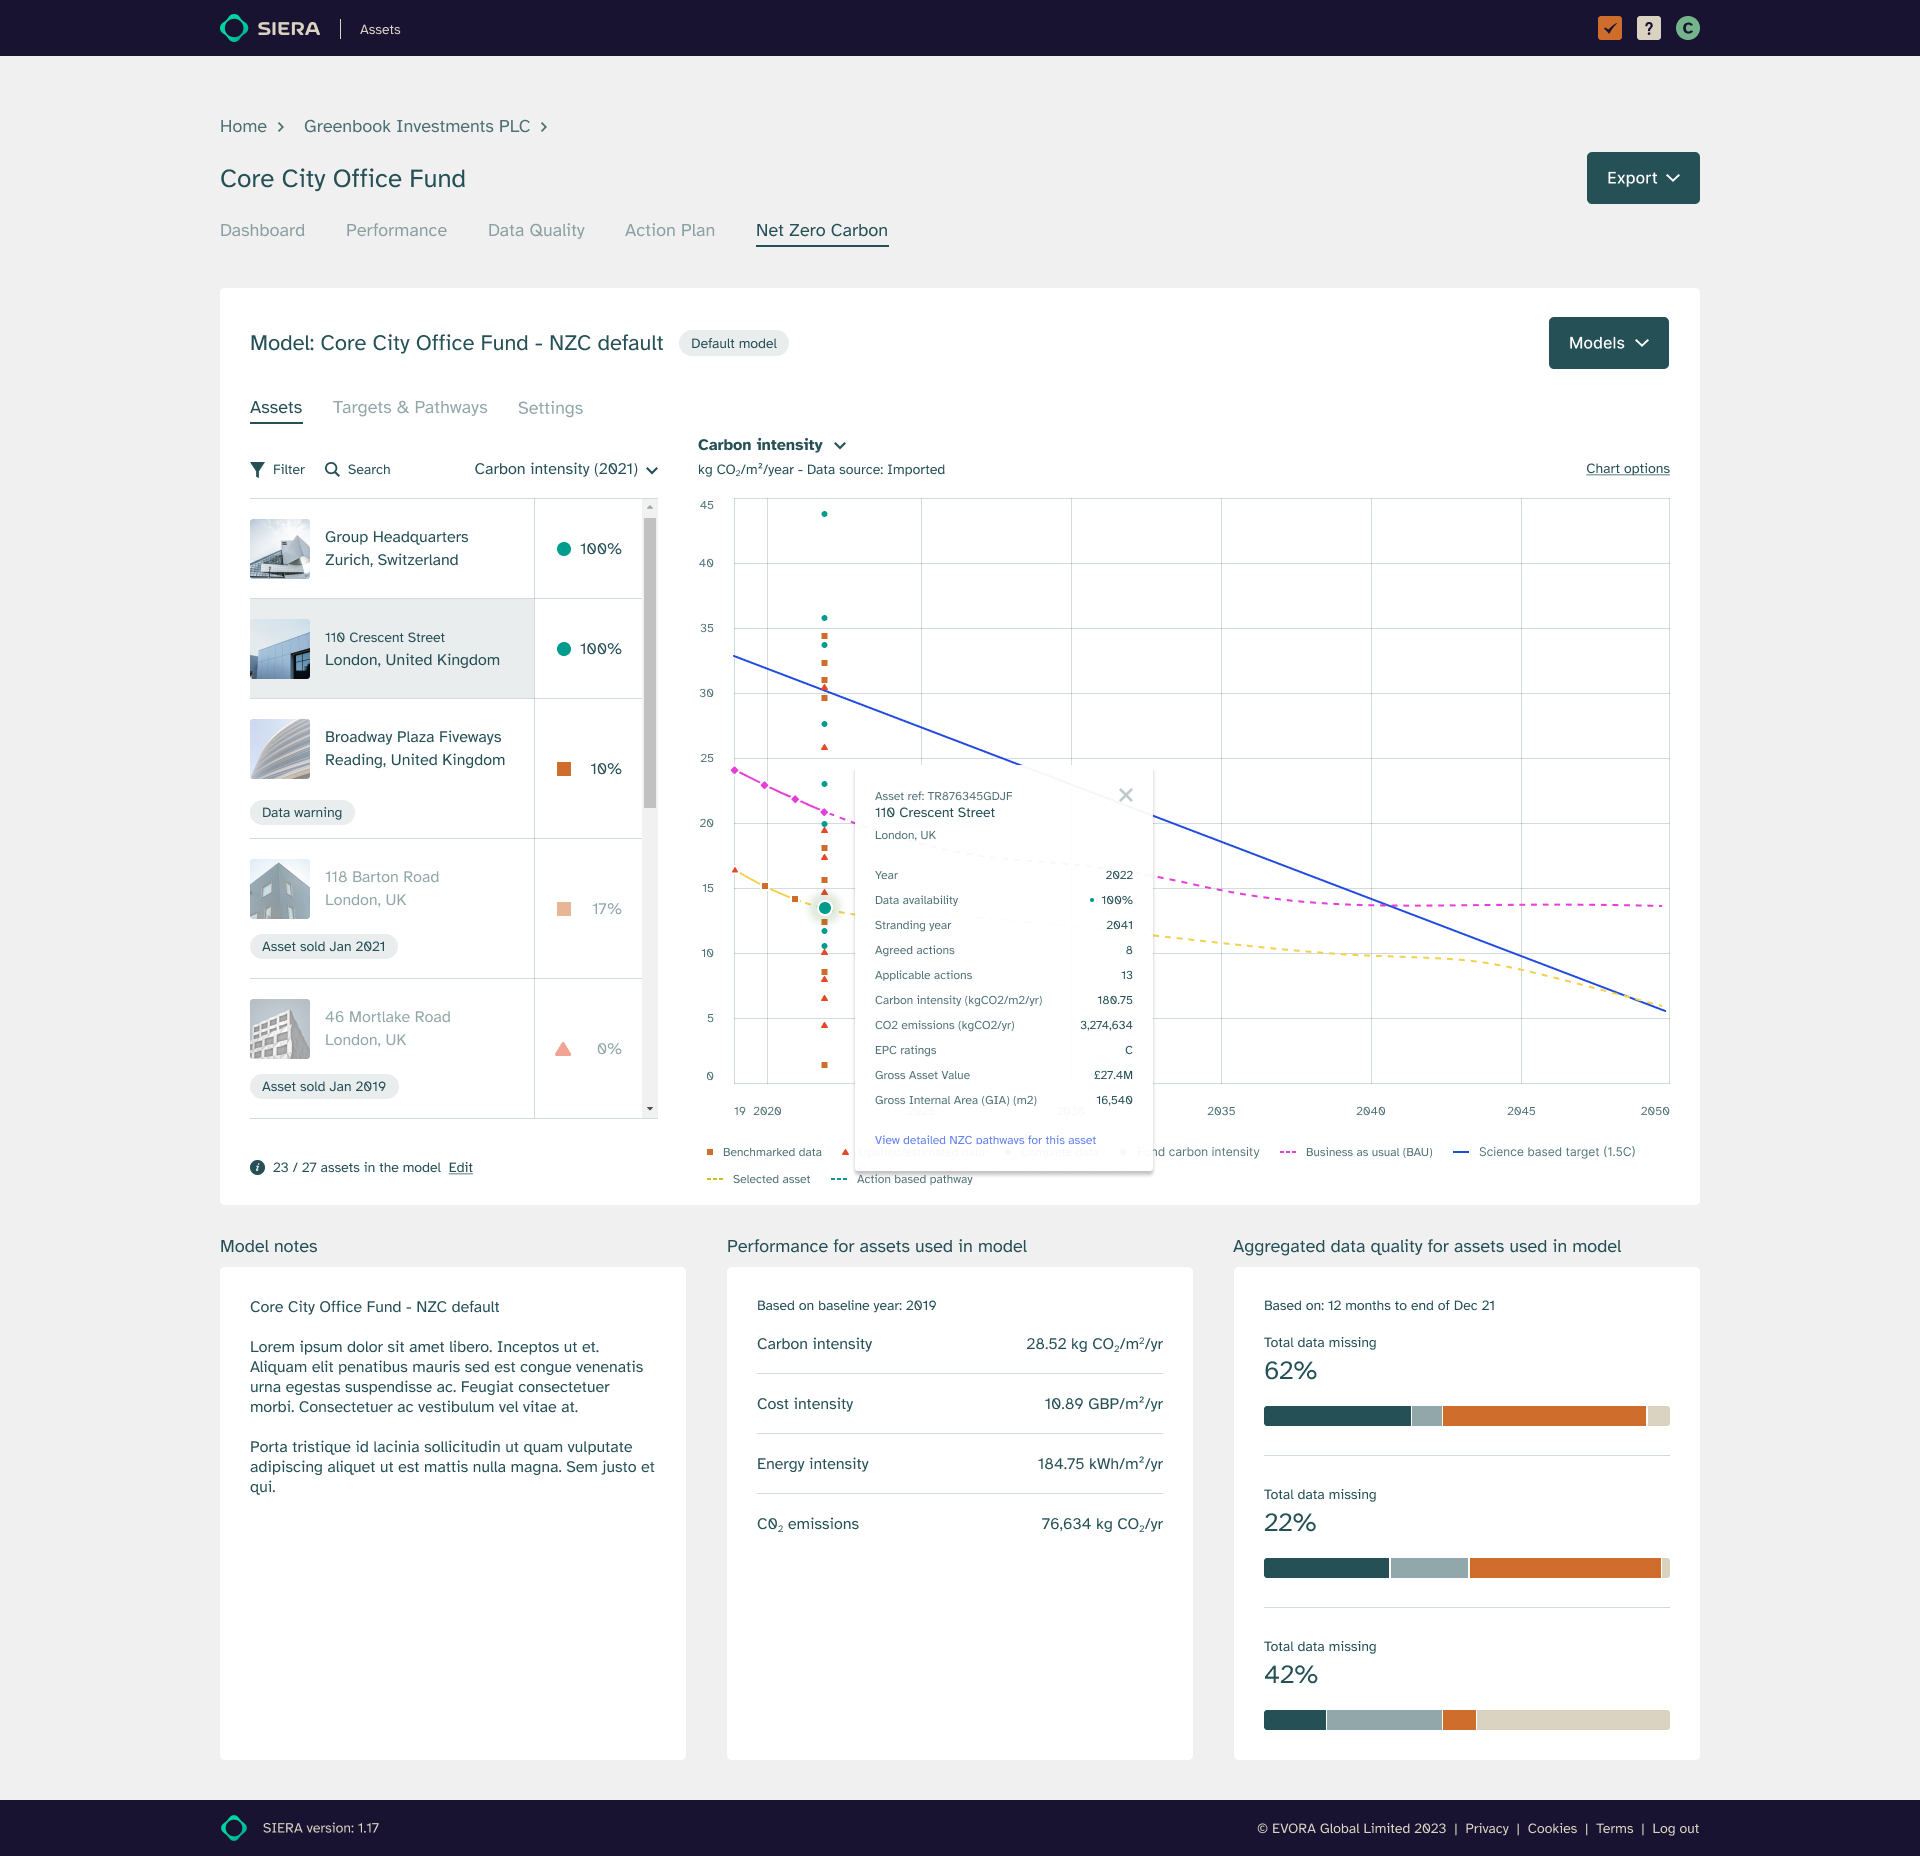
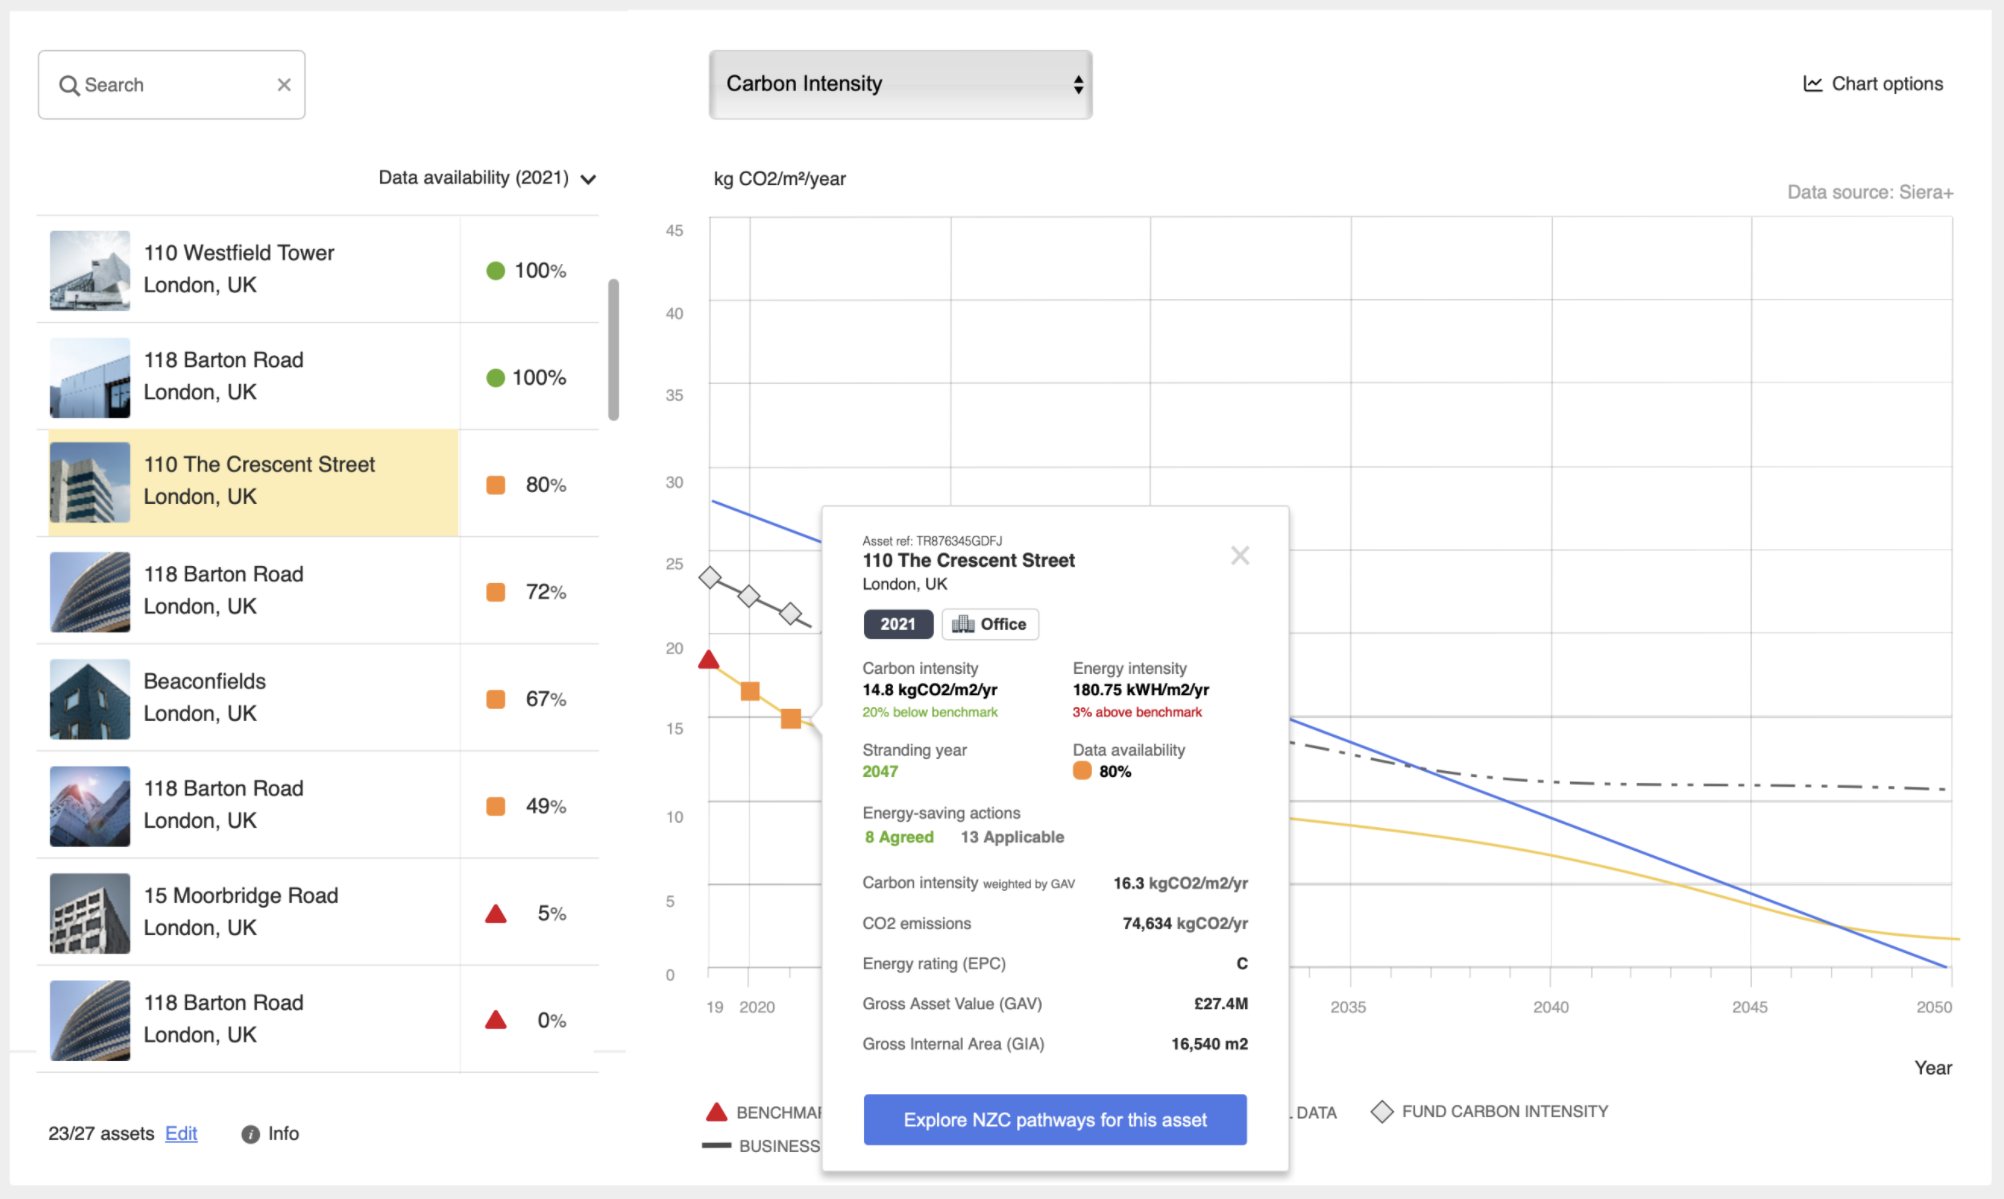
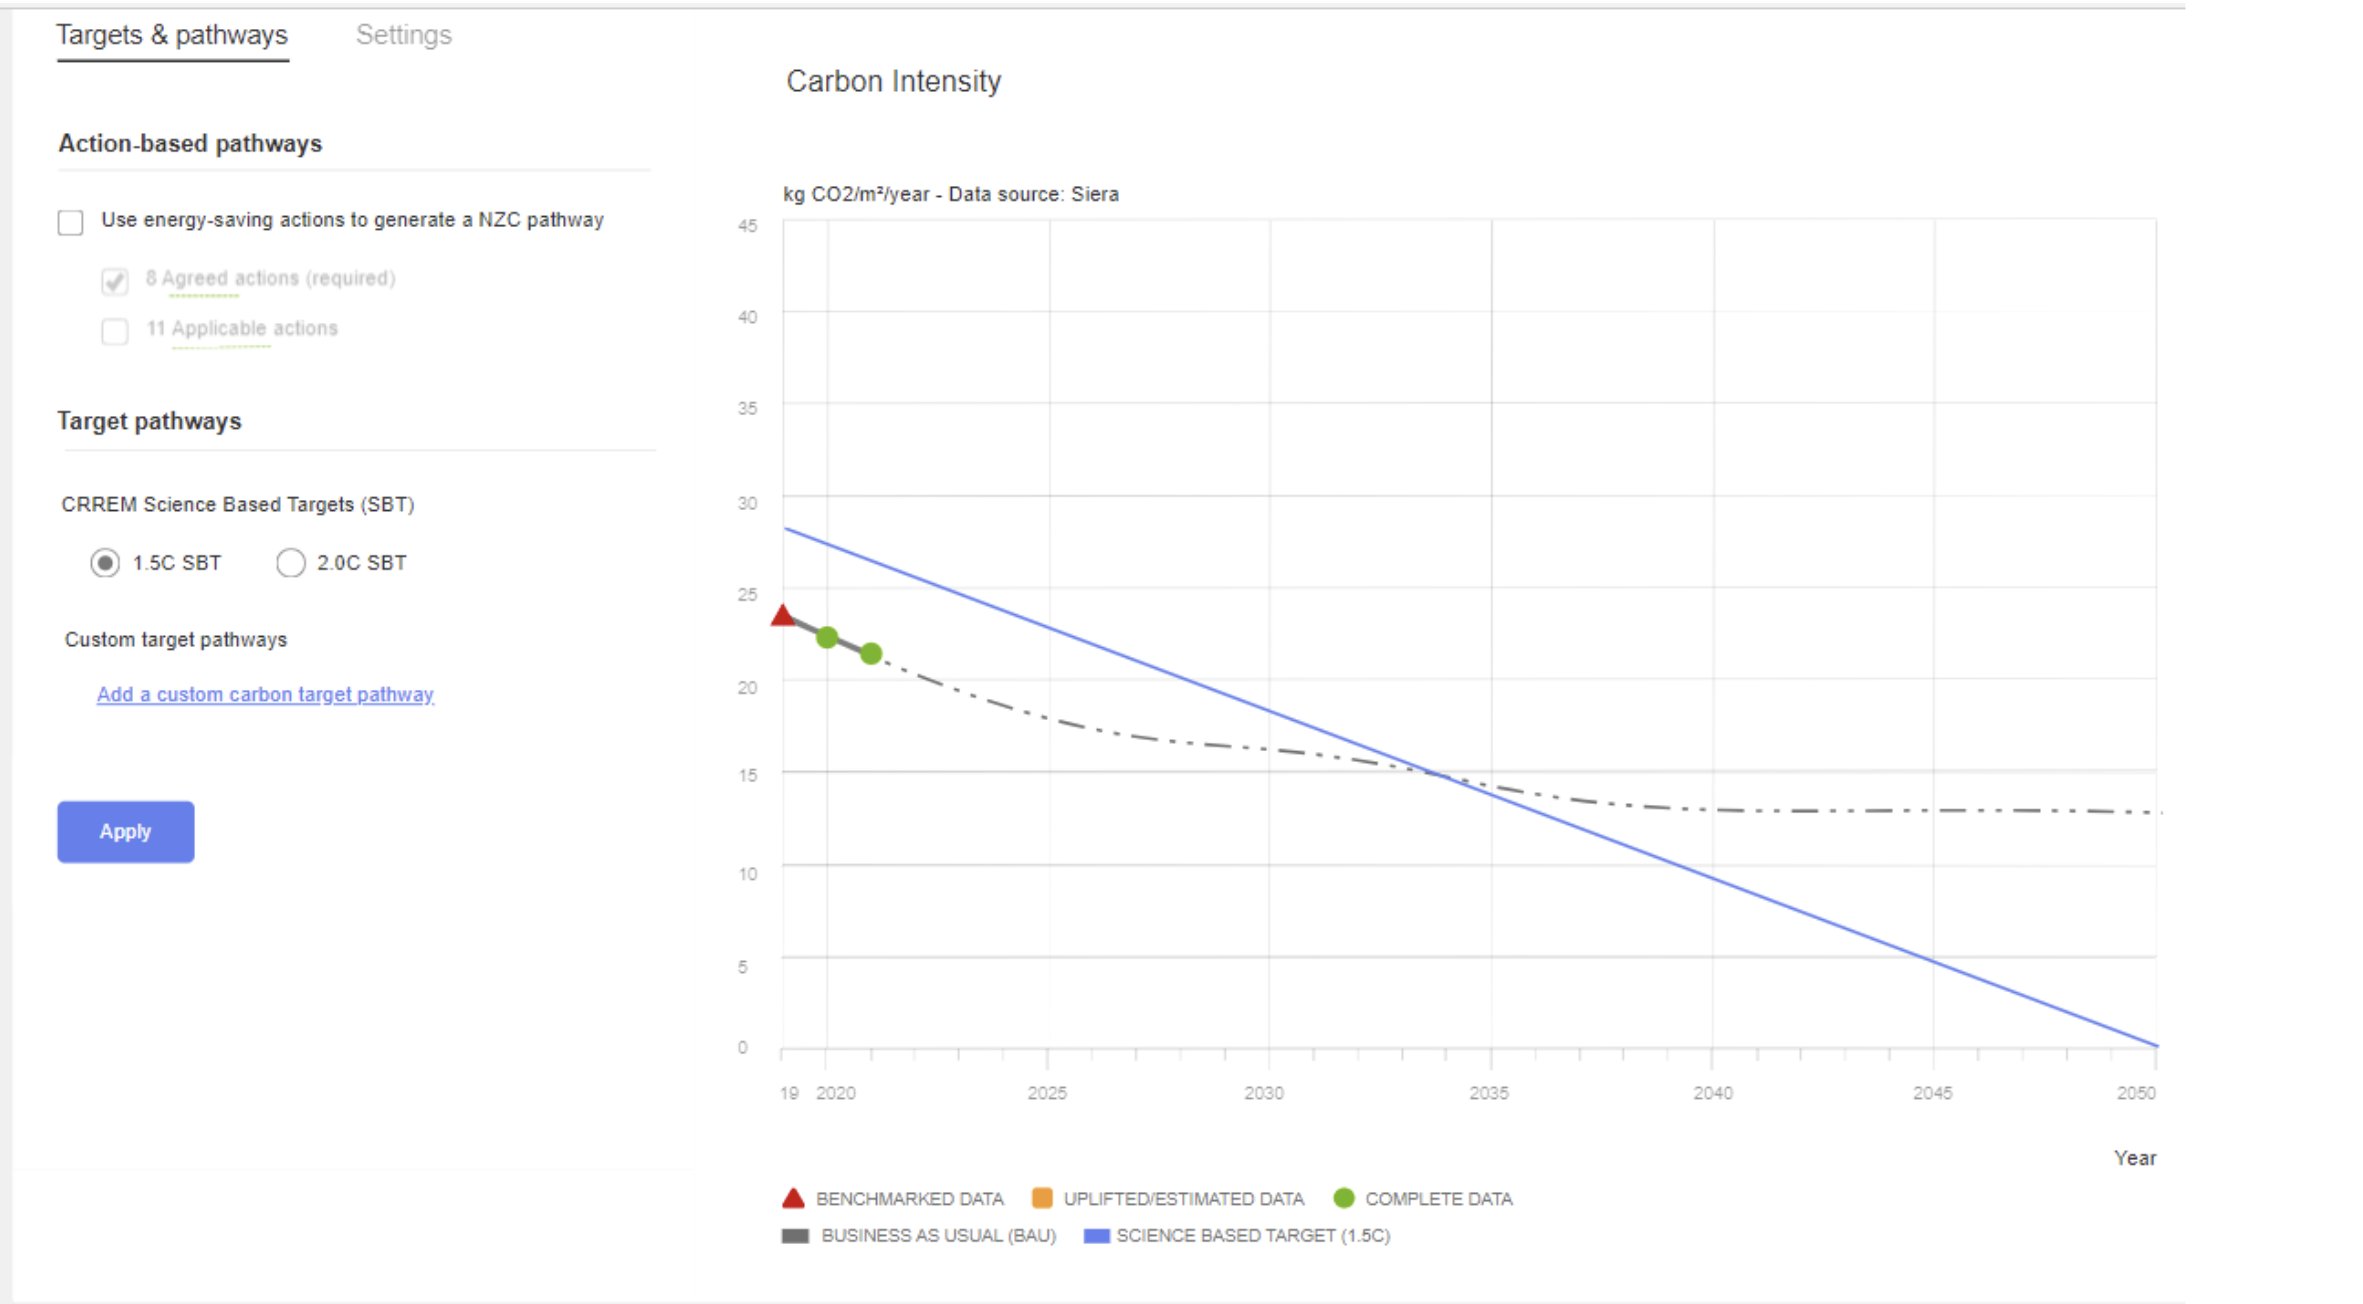
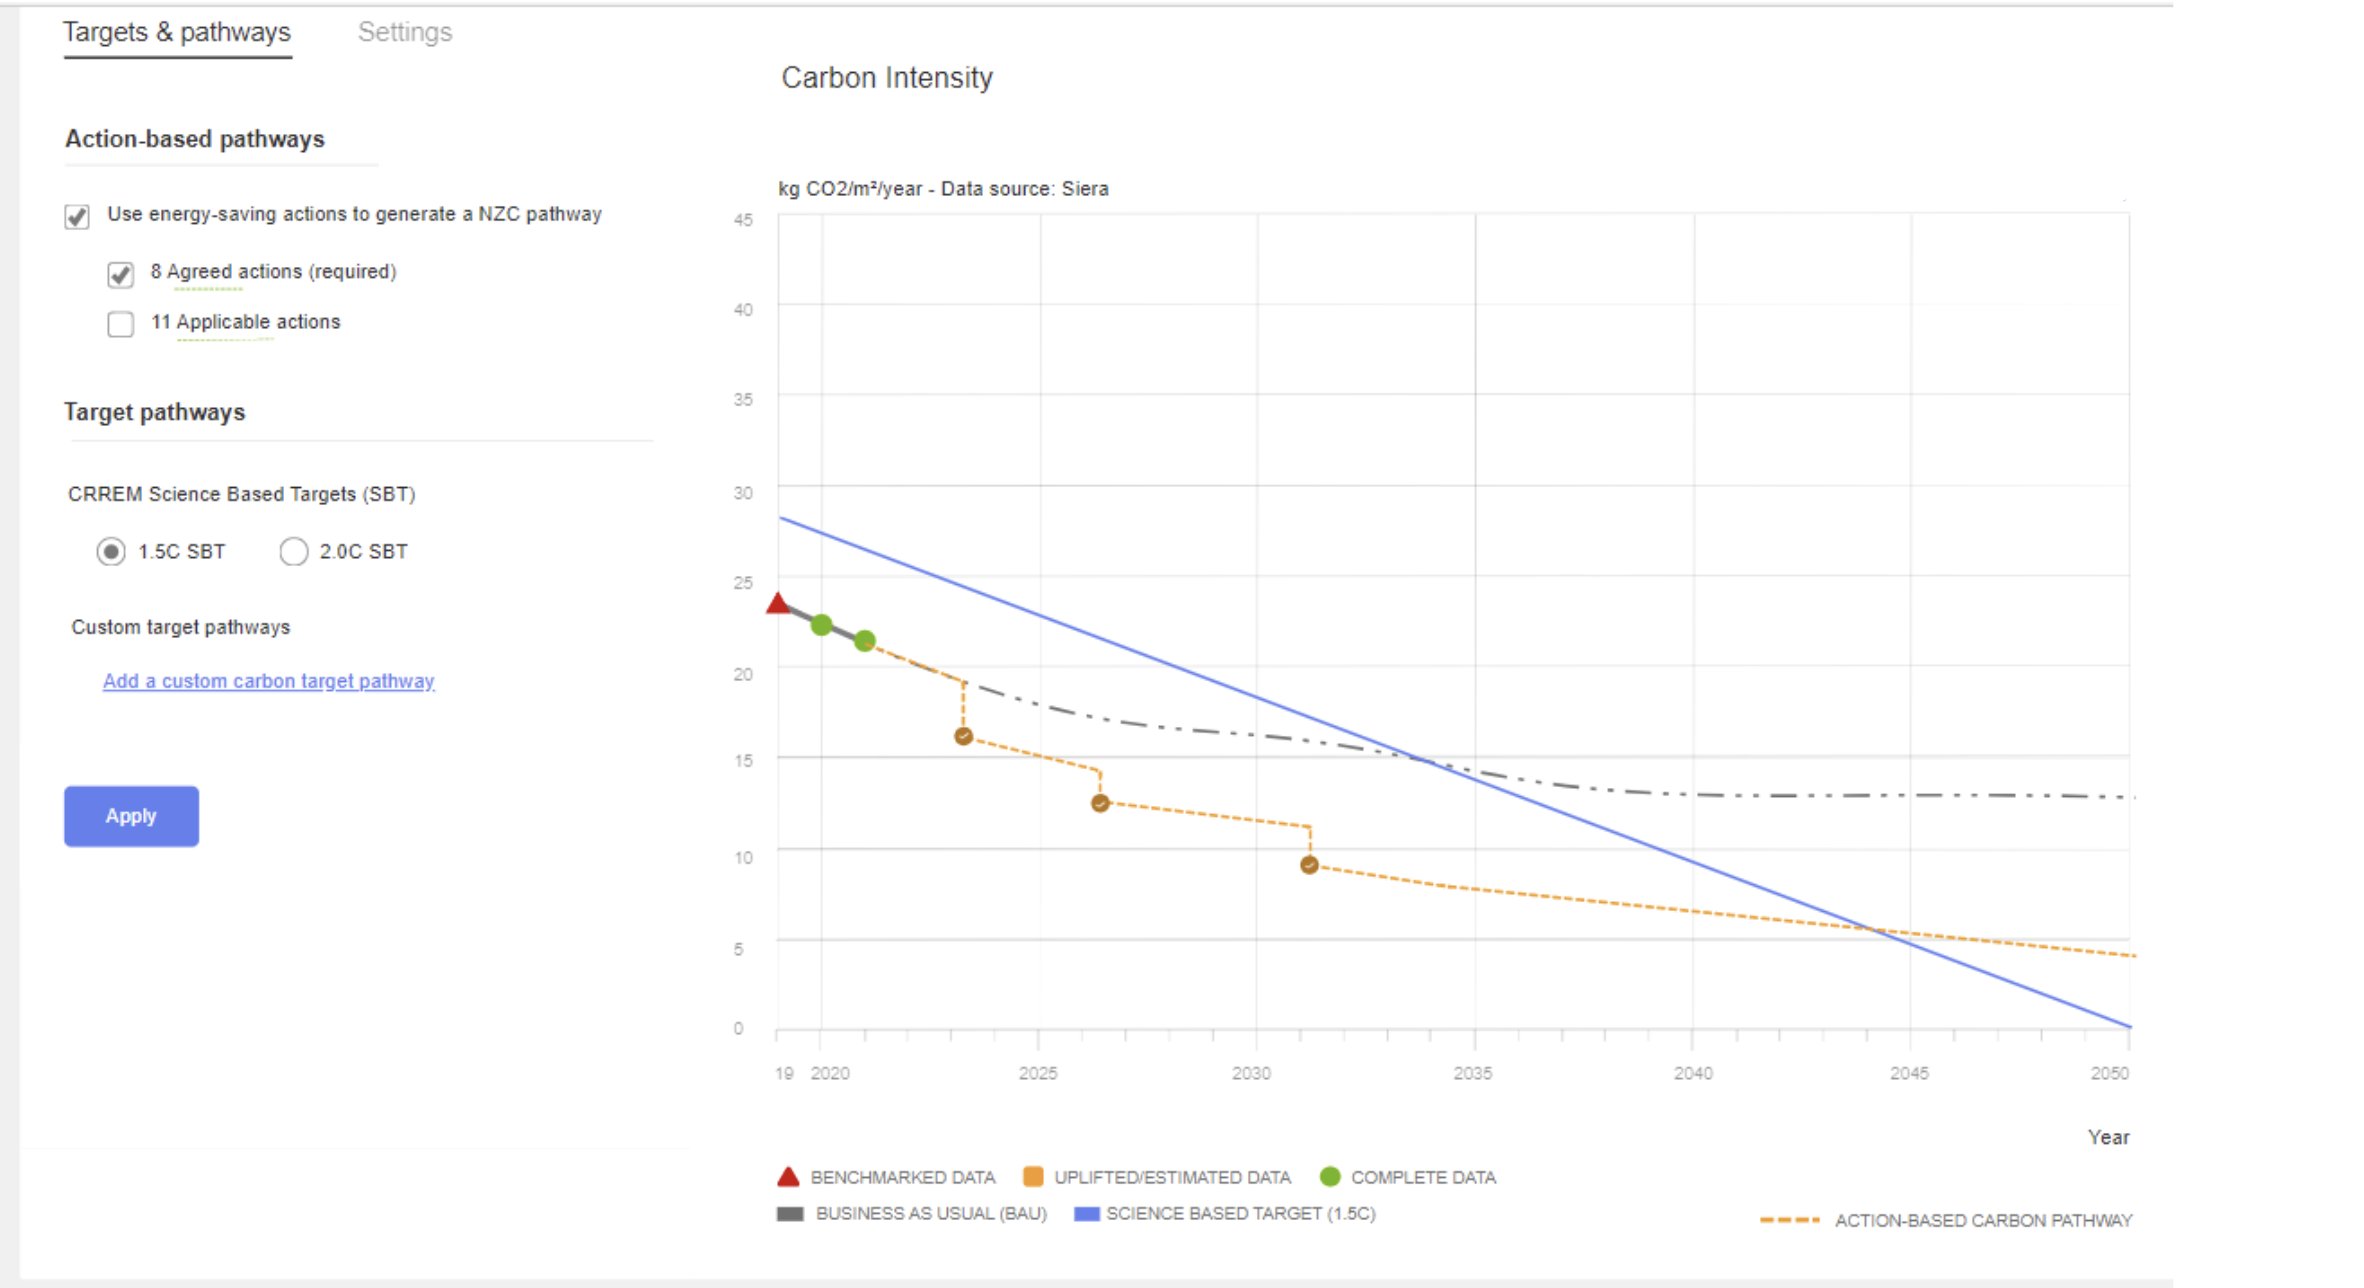
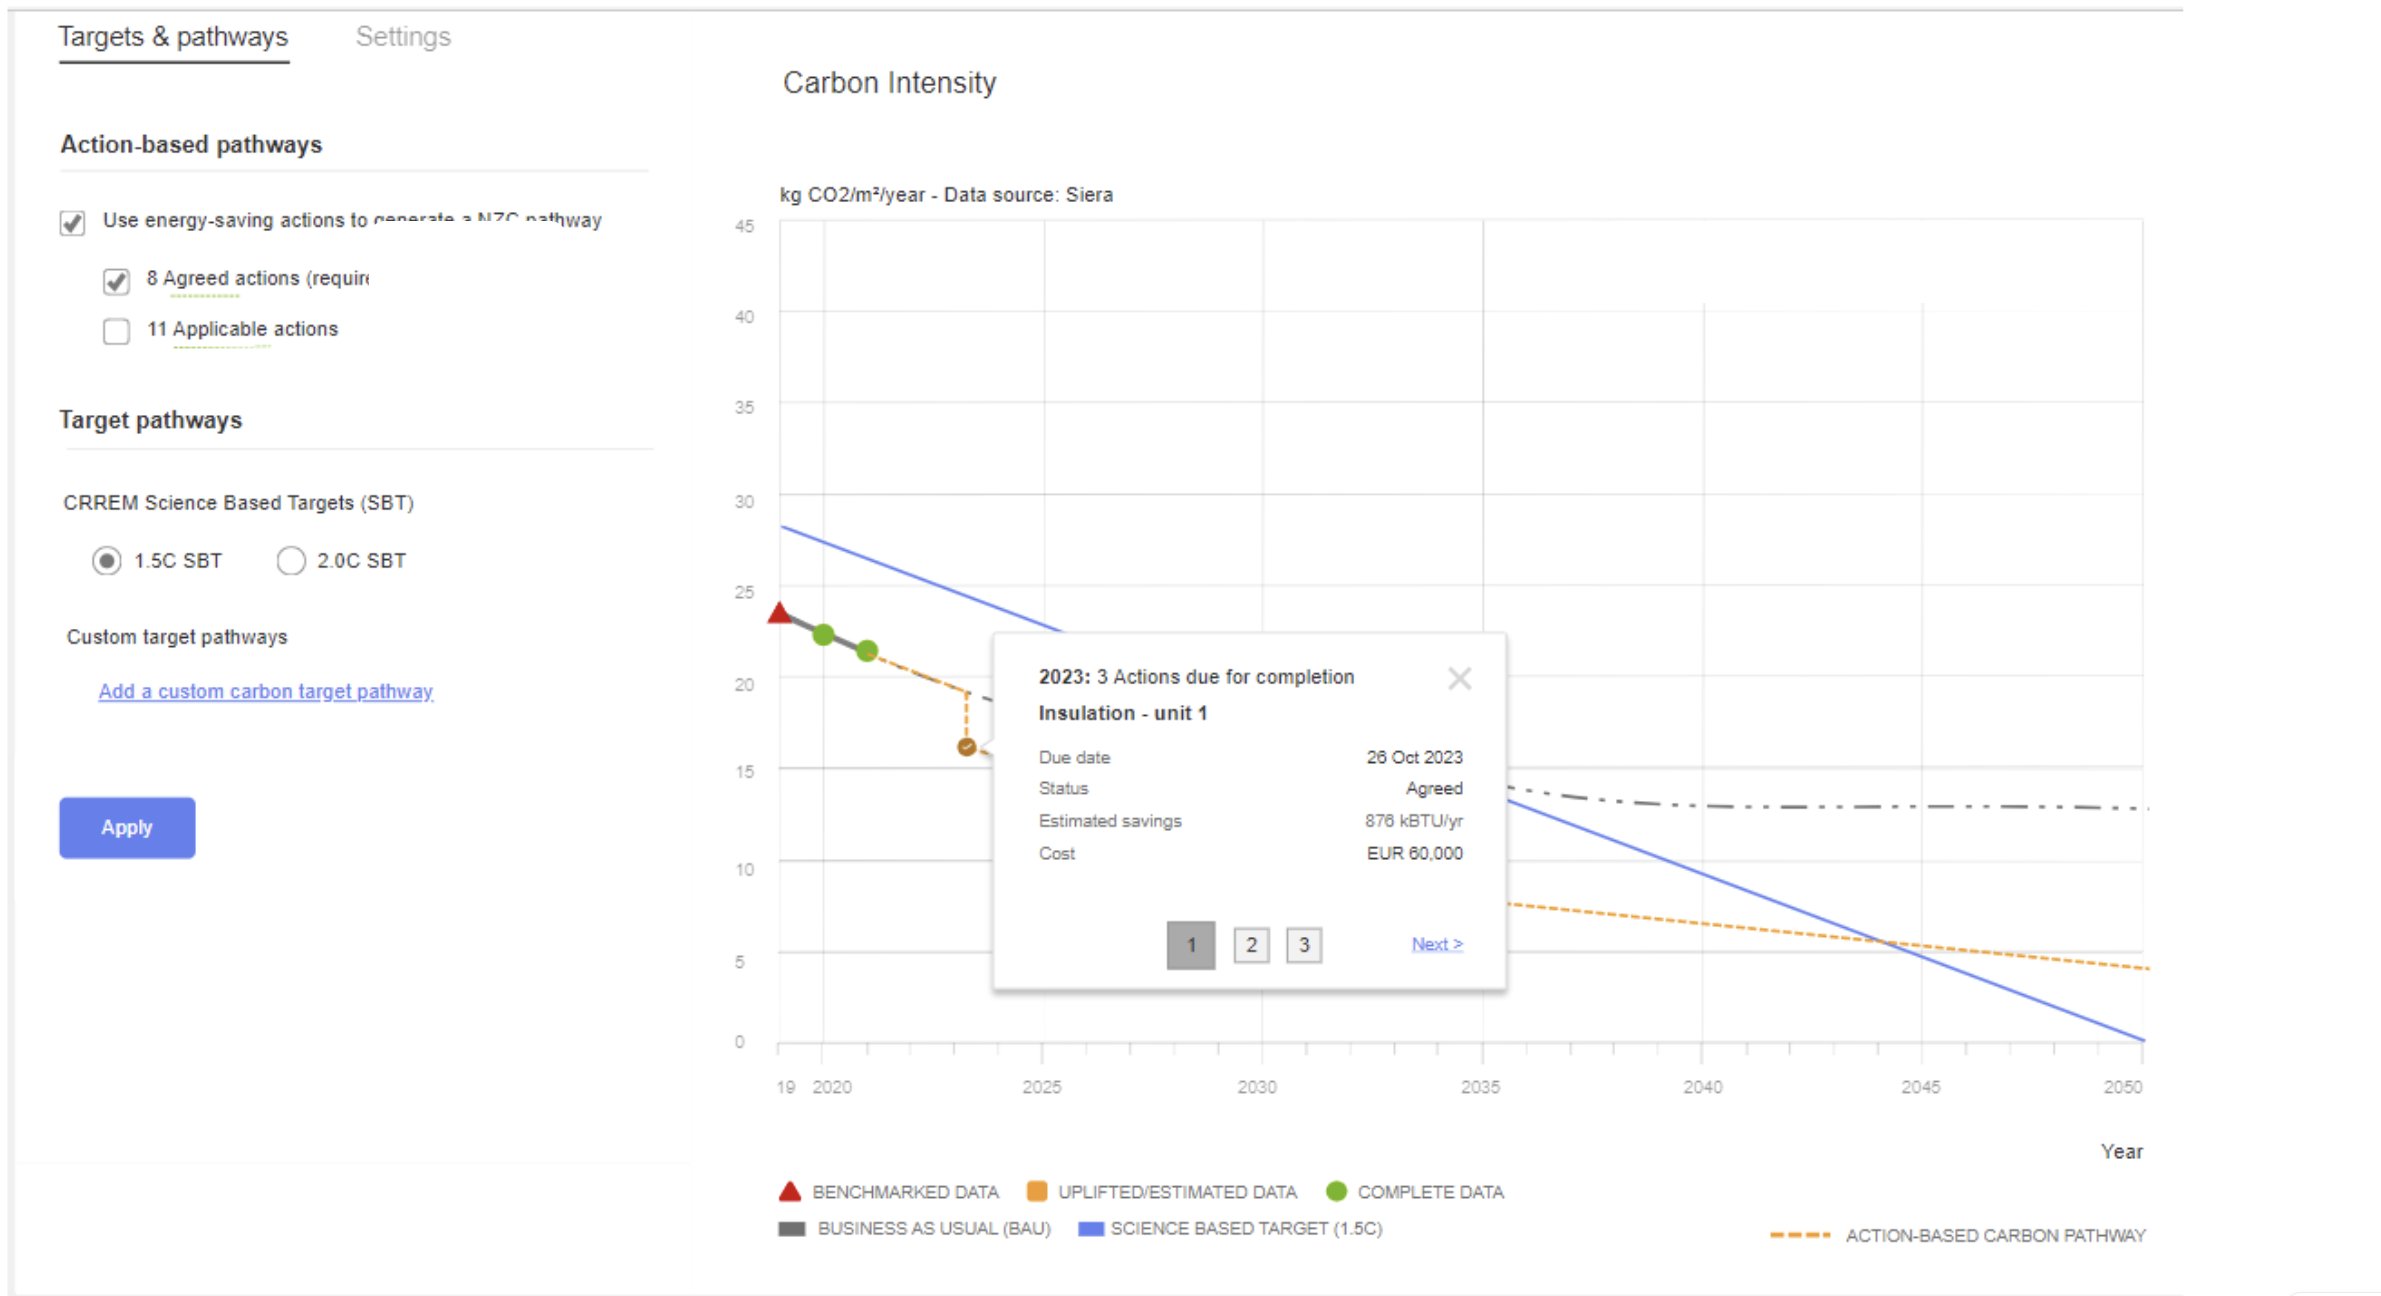
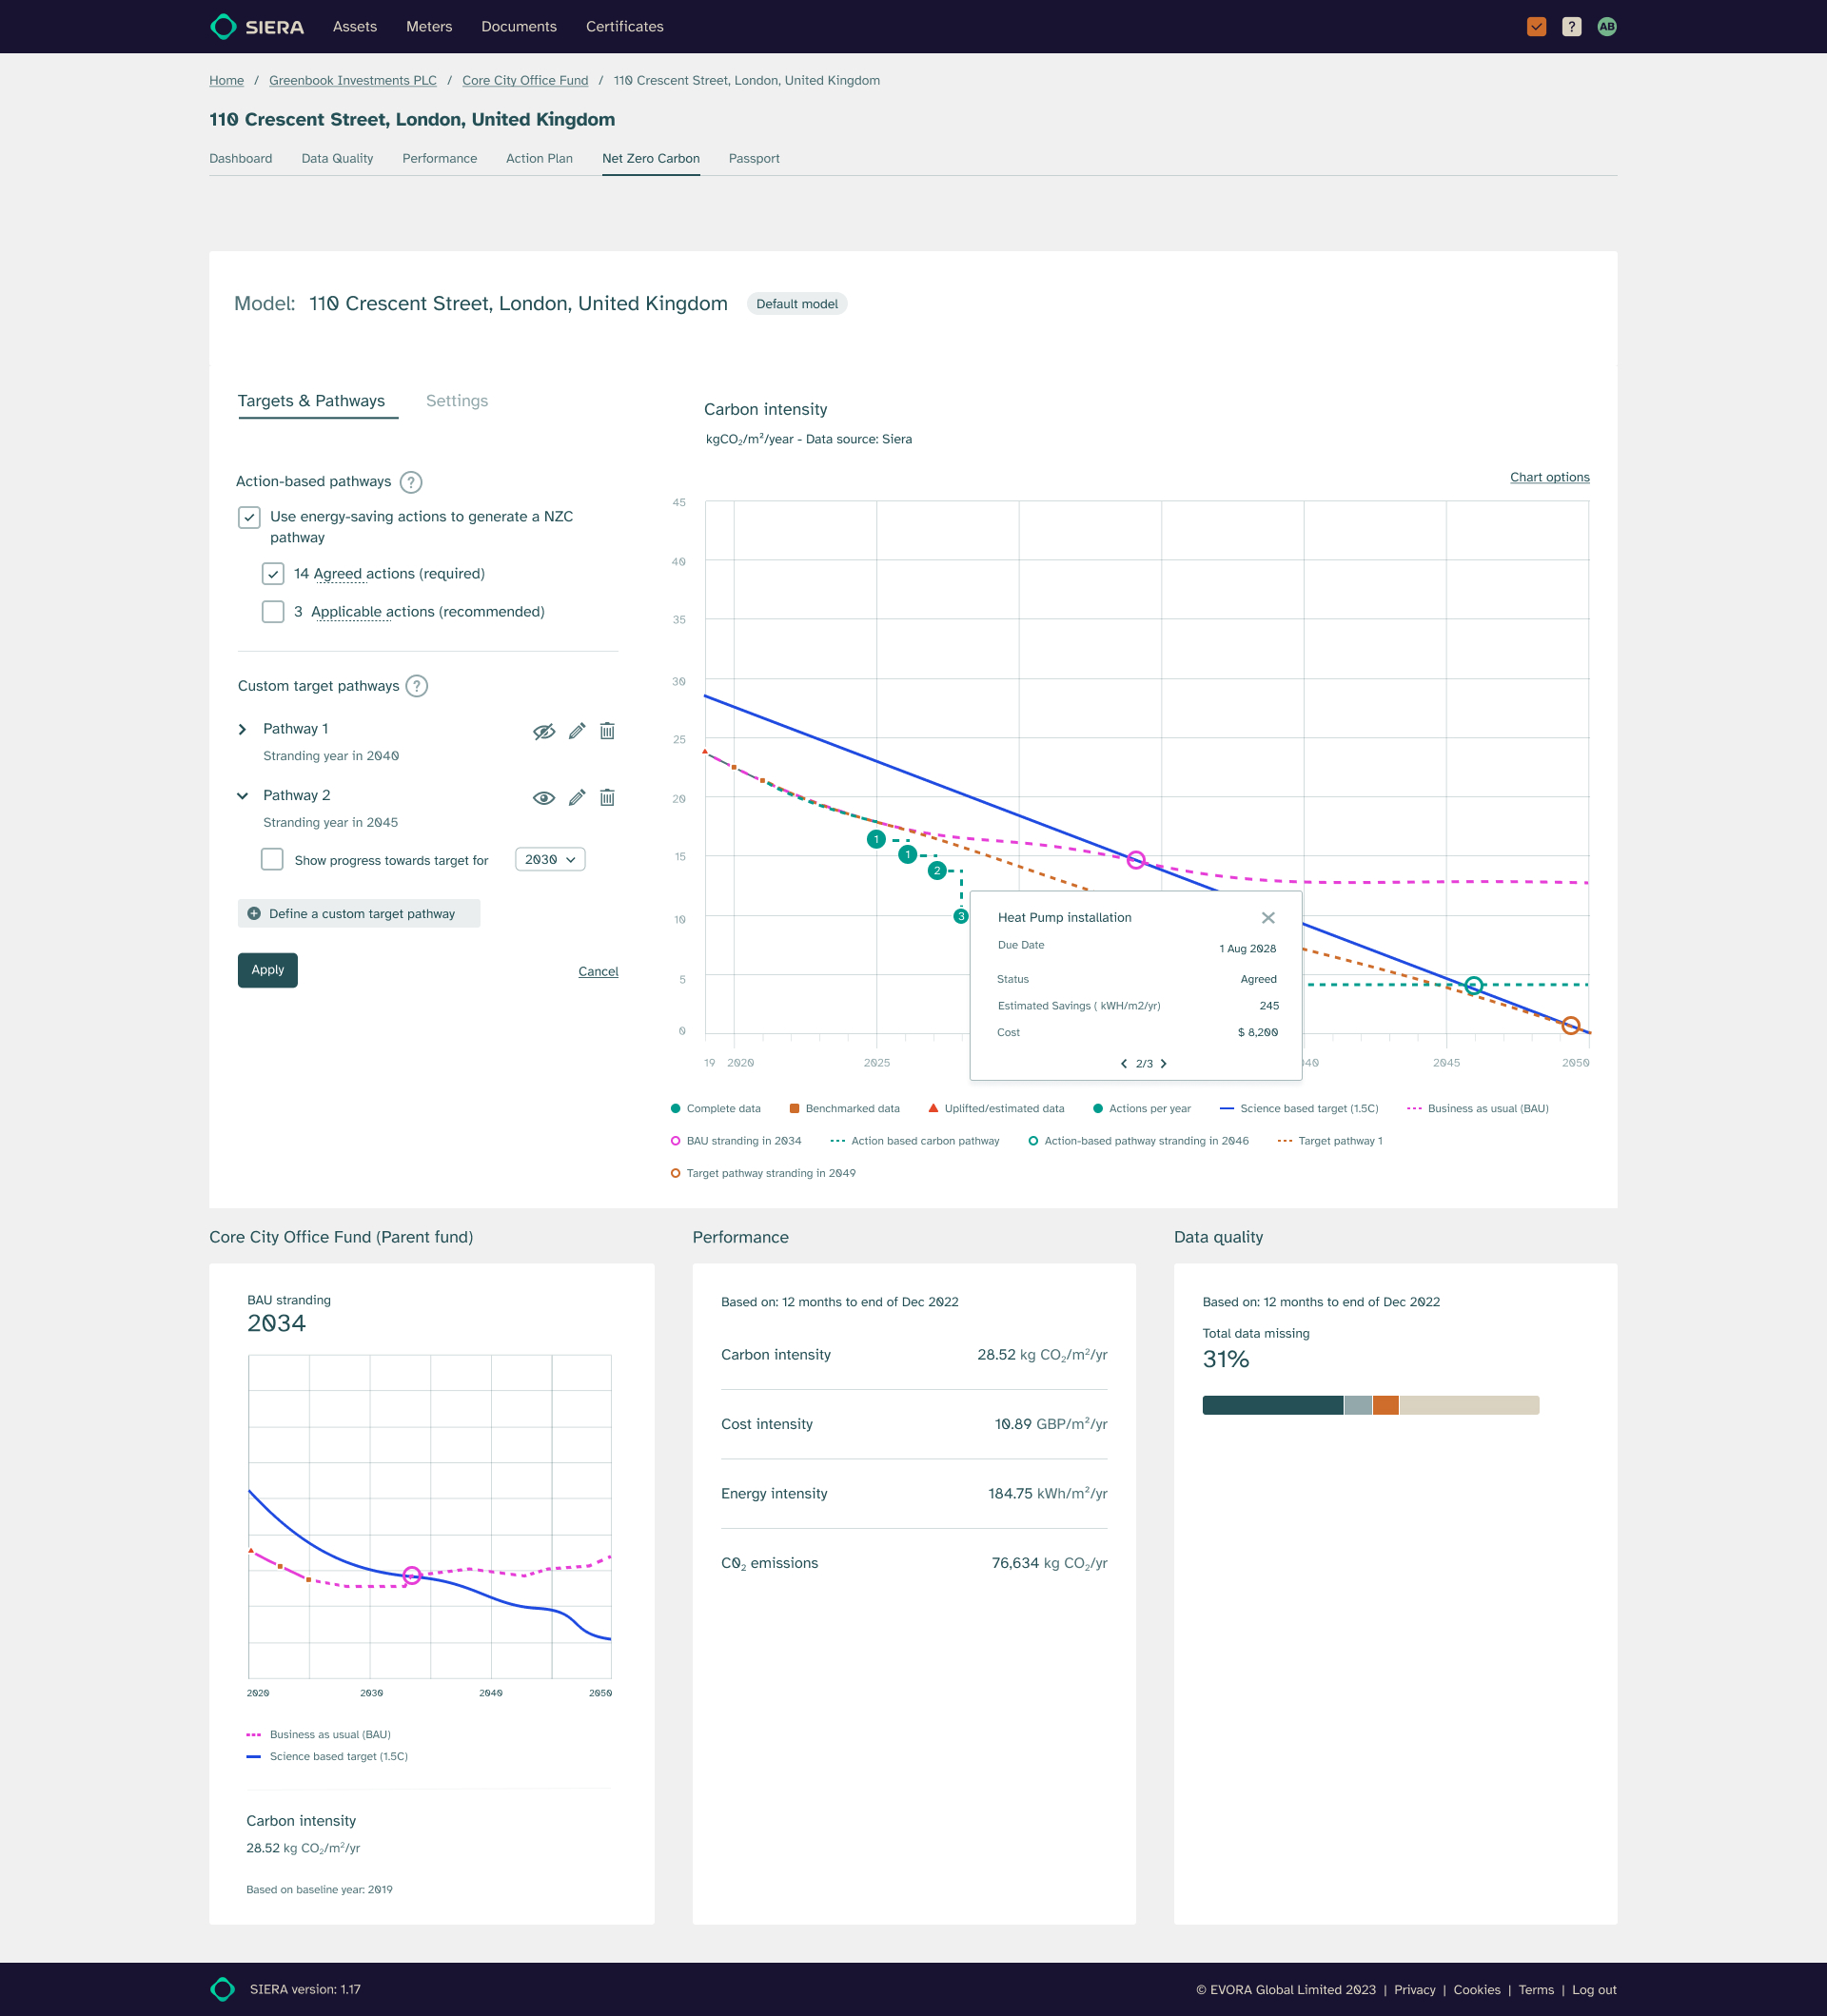
Through user research into Sustainable Action Plans, I understood how planned interventions directly impact an asset's carbon intensity year-on-year. I integrated Action-Based Pathways that show both the BAU trajectory and the specific steps needed to meet Net Zero goals — letting users see the effect of each action in real time. Hover the annotation dots to read the design rationale.

View 1 of 3 — Pathway Toggle & SBT Options
1
Pathway ToggleSwitch between BAU and action-driven trajectory
2
CRREM / SBT Option1.5C or 2.0C science-based alignment
3
Action CheckboxesSelect interventions to model decarbonisation scenarios
4
Action Pathway LineReal-time carbon trajectory with selected actions applied
5
Action Detail CardCost, savings, status and description on click
6
Paginated ActionsMultiple actions per year without cognitive overload
Key Strategic Decision

Not a wishlist.
A market position.

During client renewal conversations, there was significant pressure to simply import legacy Excel-based workflows into SIERA — giving clients exactly what they asked for, replicating what they already knew.

I pushed back on this. Not because client feedback wasn't valuable — it was — but because blindly implementing a wishlist would have locked the product into the past rather than positioning it for the future.

The Strategic Call

I analysed what clients wanted, where the ESG SaaS market was heading, what differentiated SIERA from competitors, and what would make NZC the best carbon pathway tool in the market — not just the most familiar one. That required saying no to some requests and yes to others for reasons beyond the immediate client relationship.

Why It Mattered

Clients need to trust that the product they are renewing has a vision — that it will be better in two years than it is today. Showing strategic direction, not just responsiveness, was what retained high-value clients and attracted new enterprise accounts who wanted a platform that was built to lead the market, not follow it.

"The difference between a product team and a design consultancy is that a product team has a point of view about where the market is going — and builds toward it."
The decision not to replicate Excel workflows verbatim was one of the most commercially significant calls made during NZC development.
05 — Product Analytics

Pendo embedded
before every release

I defined critical user events, set success thresholds, and embedded Pendo tracking before each feature shipped — so we could measure whether design decisions actually landed.

Leadership & Collaboration
Led cross-functional team of Junior POs, developers, principal UI, and sustainability experts. Presented bi-monthly UX impact analyses to investors and senior stakeholders.
Event TrackingFeature AdoptionDrop-off AnalysisA/B Testing
Task Completion Time
−24%post redesign
🎯
Bespoke Feature Interaction
+38%vs baseline
👥
Research Participants
4 → 72month one
🔁
Client Retention
80%contribution
Delivery Process

Research-led.
Every time.

01
Domain Immersion
Science workshops with sustainability experts before any wireframe.
Miro
02
User Research
Moderated sessions, recorded + transcribed. Thematic analysis in Dovetail.
Dovetail
03
Card Sort & IA
Rebuild IA around user mental models — not engineering data structure.
Miro
04
Mid-High Prototype
All testing at mid-high fidelity — low-fi insufficient for complex data UI.
Axure
05
A/B Testing
In-person and remote. 10 participants minimum per cycle.
UserTesting
06
Ship & Measure
Pendo embedded before release. KPIs tracked against predefined thresholds.
Pendo
05 — Business Impact

Design as the
growth engine

NZC became SIERA's most commercially successful product. Every outcome traces directly to a design decision made through this research-led process.

Foundations — Drill-Down Navigation

A fundamental step in building strong foundations for the Net Zero module was defining how users could drill down from a portfolio fund view to the individual asset level. This interaction needed to feel intuitive, seamless, and adaptable for diverse user types.

I designed a high-fidelity prototype showing the complete drill-down journey — users could move between levels of data with minimal clicks, while maintaining context on carbon pathways, key performance metrics, and action-based interventions.

For every iterative cycle, I conducted usability tests with 10 participants — including inhouse internal consultants. From the feedback, I created thematic clusters highlighting recurring needs and pain points, translating them into actionable design improvements for continuous development of Net Zero.
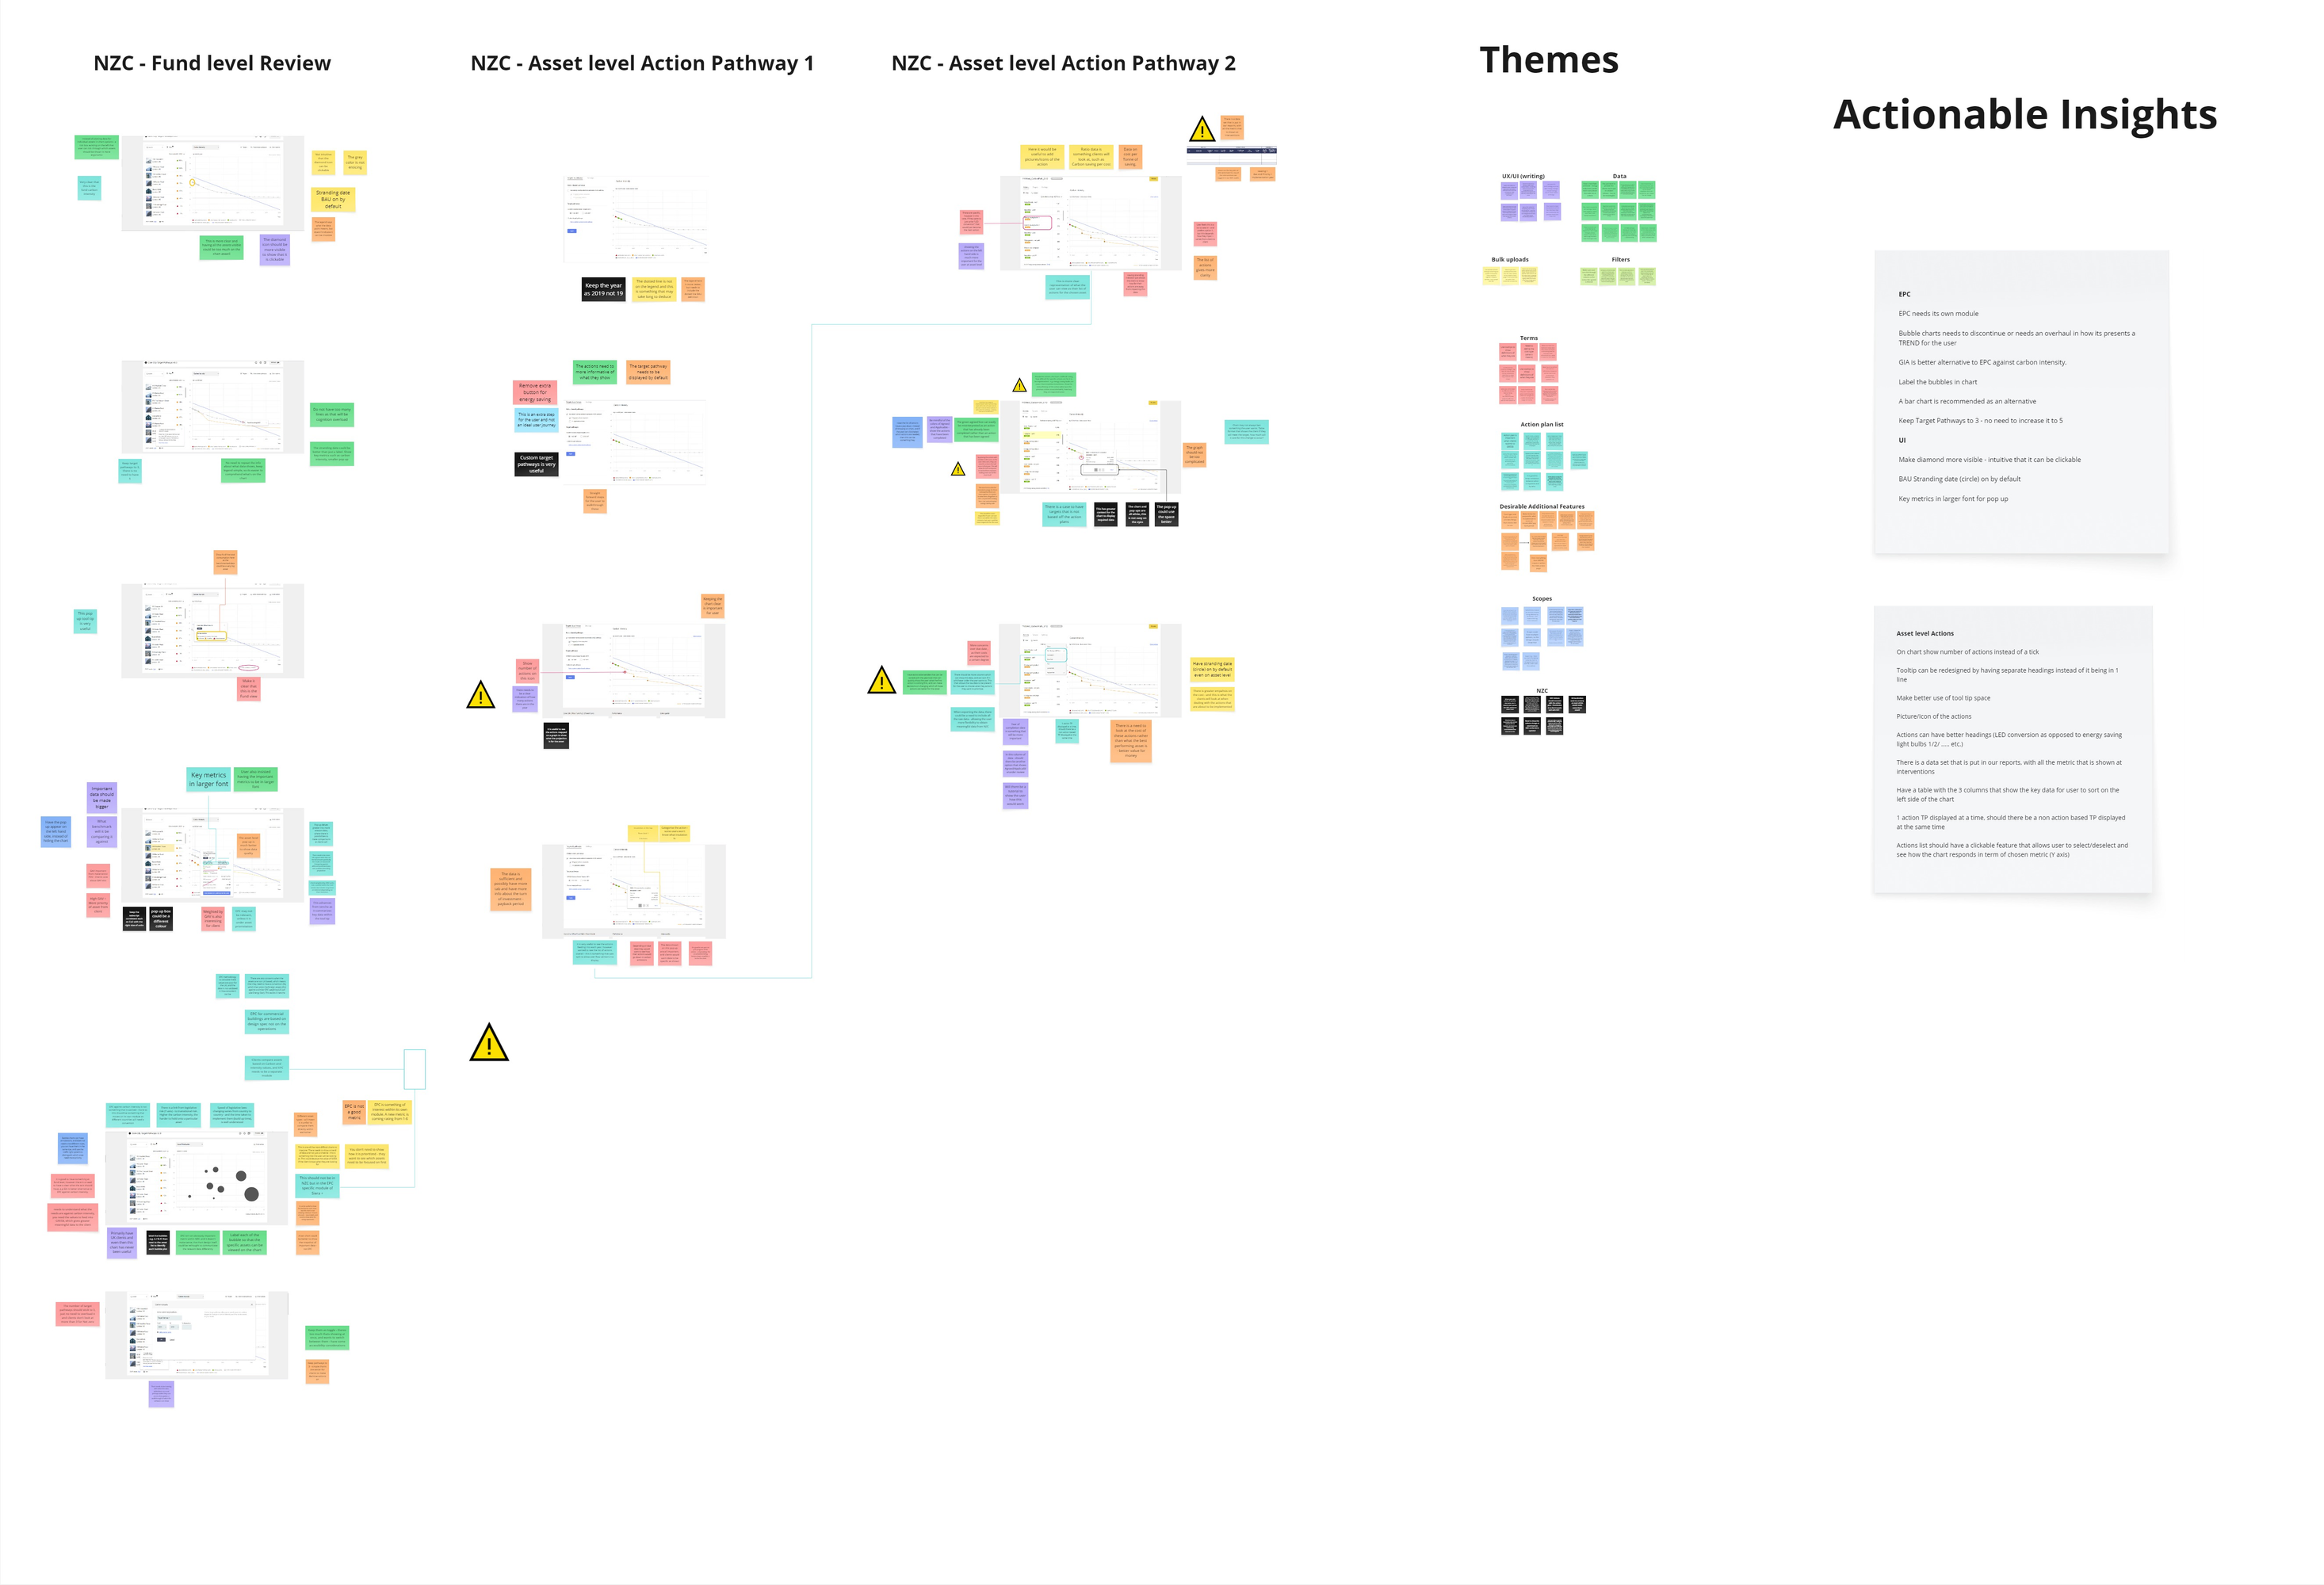
User testing feedback analysis on an iteration from Fund to Asset NZC
🏆
7-Figure Client Retained
Integral to securing multi-year, seven-figure enterprise commitments through design-led product confidence.
🌎
Largest North American Client
Secured a major US infrastructure client, expanding SIERA beyond real estate. NZC was the primary sales asset.
📈
Most Marketable Module
Became SIERA's lead product in investor presentations — directly influencing six-figure enterprise deals.
Exec-Driven Accessibility Upgrade
User testing evidence led to an executive decision to replace bubble charts platform-wide.
🧱
Foundation for 5 New Products
The IA and design system became the scaffold for every subsequent SIERA module post-rebrand.
🔬
Research at Scale
72 participants, recurring cycles — directly shapes product direction and contributes to 80% client retention.
The Shipped Product

What users see today

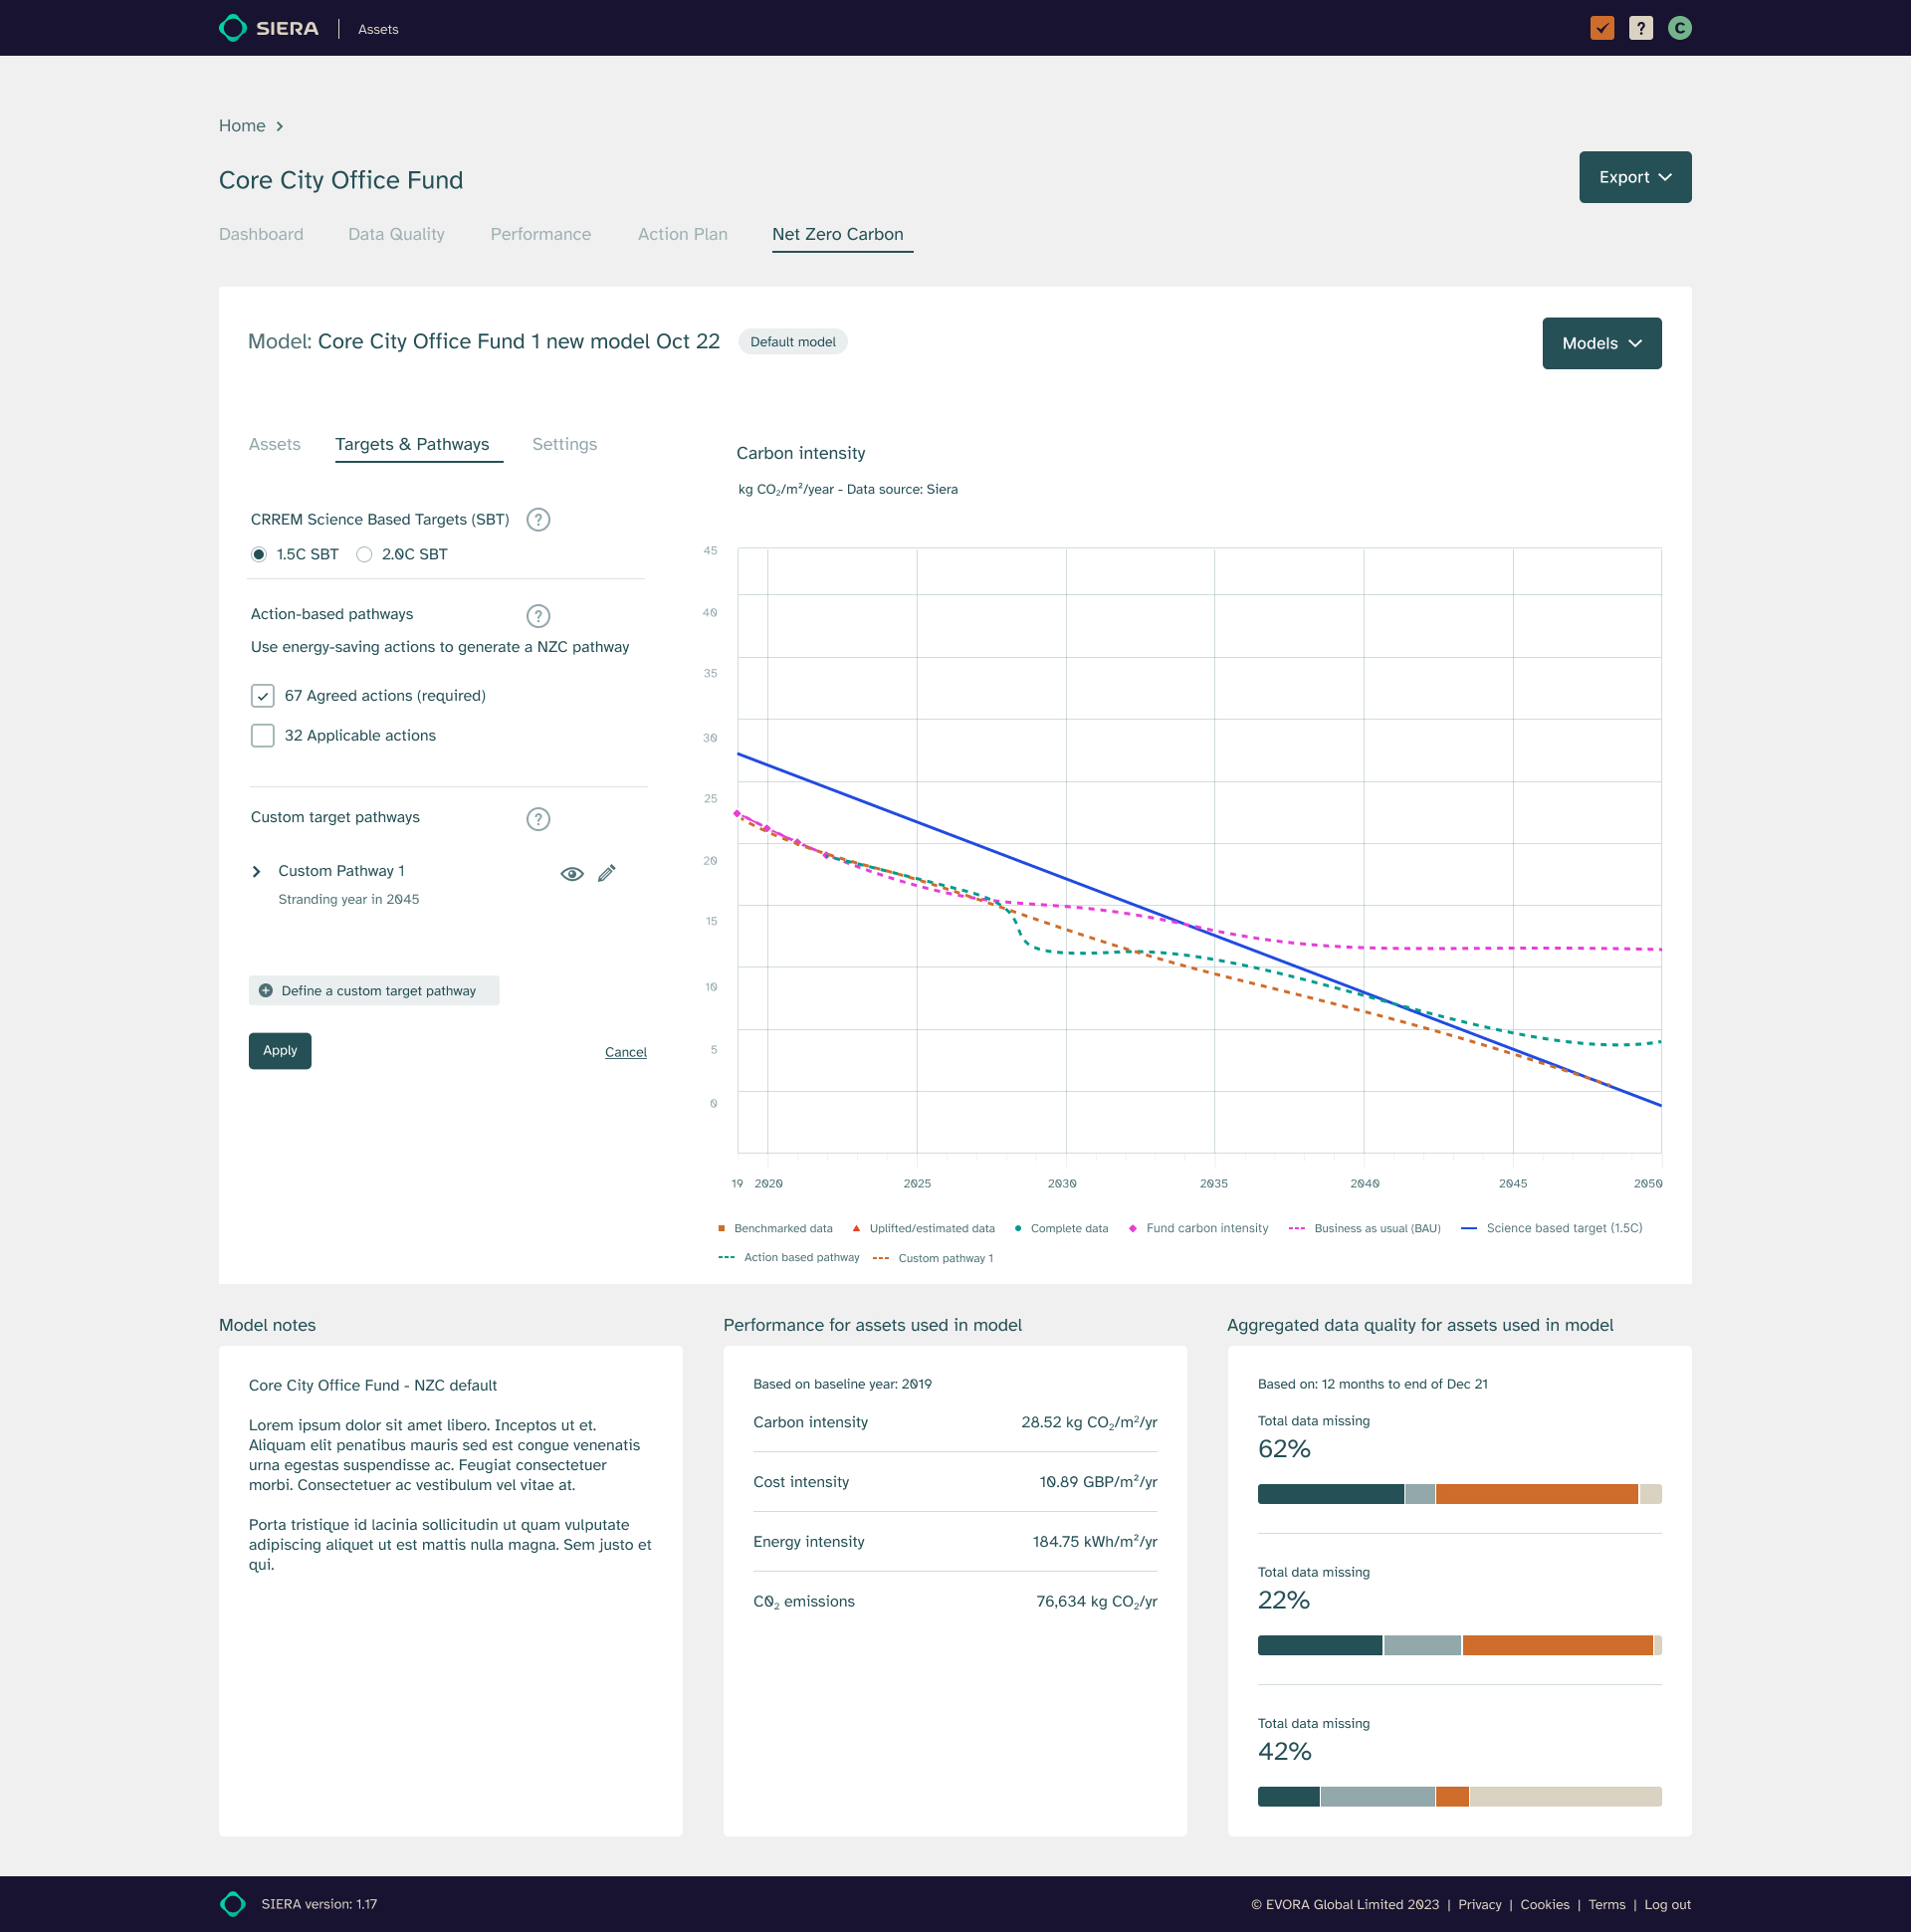
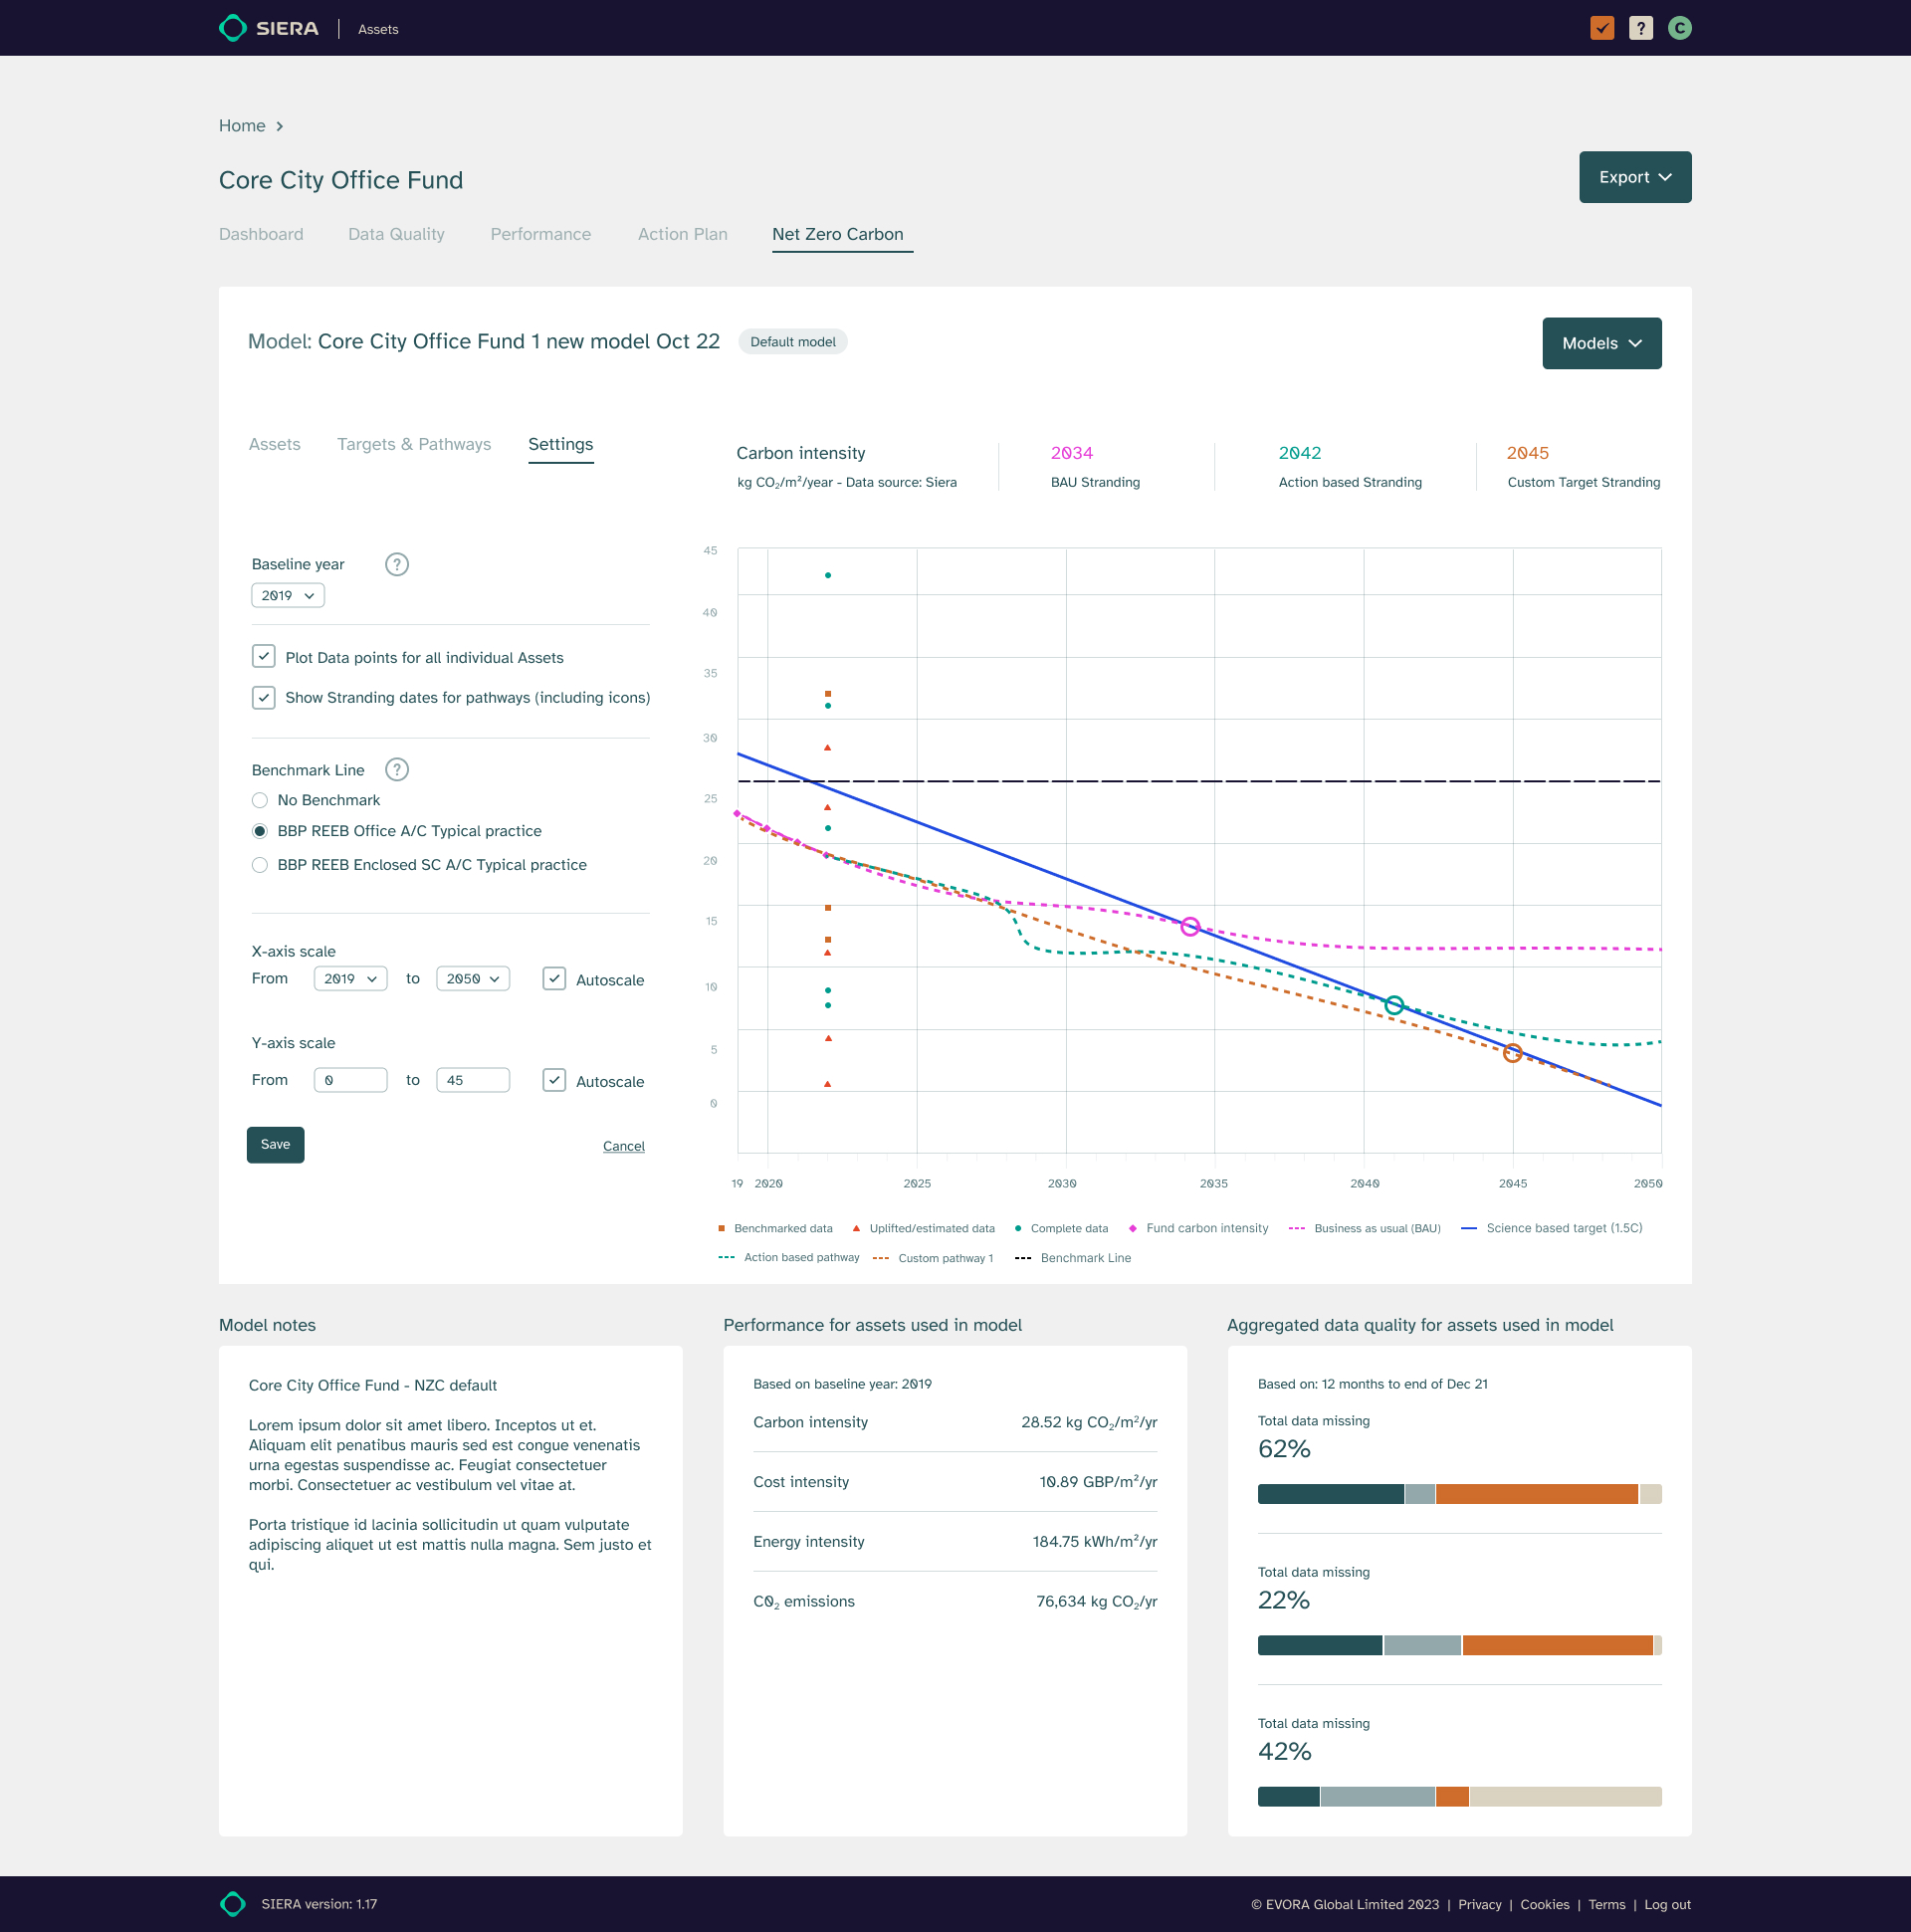
Three views from the live Net Zero Carbon module — the result of 3+ years of continuous research-led iteration.

1 of 3 — Action plans pathway Asset level
What I'd Do Differently
I'd instrument Pendo analytics earlier in the process — before the research phase, not just before launch. Baseline behavioural data from day one would have given us harder evidence for prioritisation decisions.

Explore more work

Return to the homepage to view other case studies
← Back to Home Get in touch